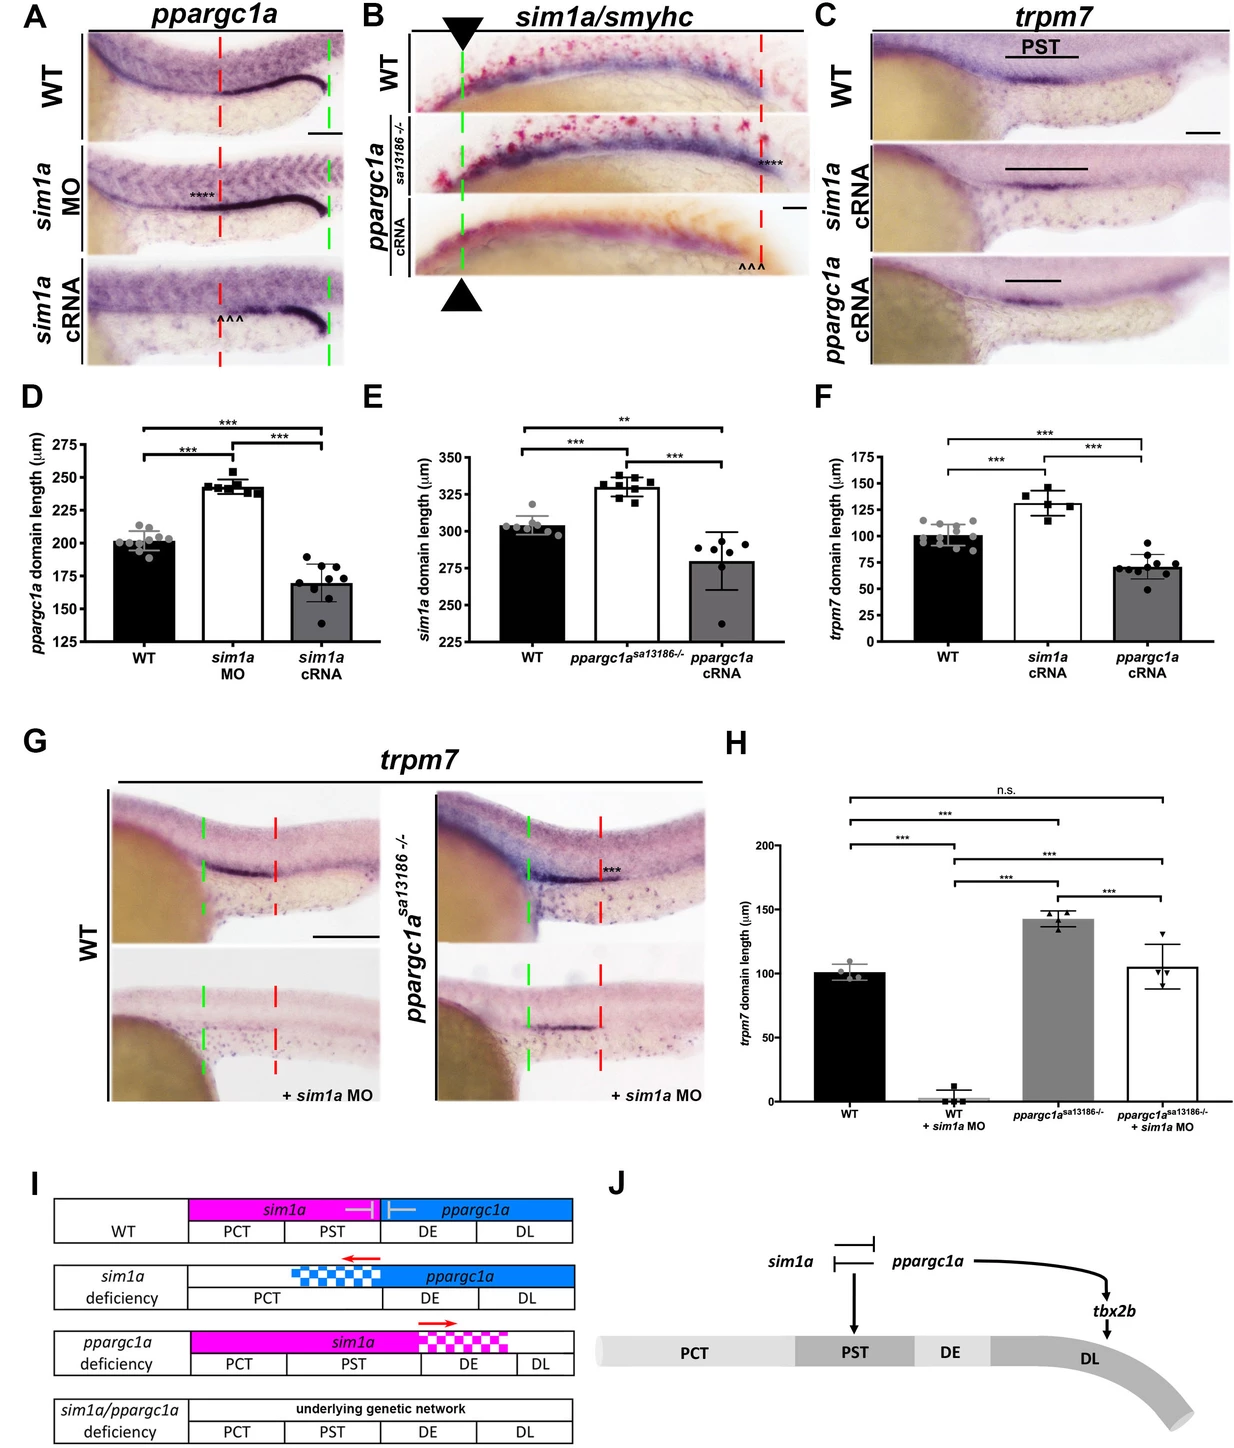
Fig. 5 ppargc1a and sim1a have a reciprocal antagonistic relationship that is necessary to negotiate the PST segment boundary. (A) WISH for ppargc1a (purple) expression at 28 ss in WT, sim1a MO, and sim1a cRNA injected zebrafish. The green and red dashed lines indicate the beginning and the end of WT expression, respectively, the expansion of the ppargc1a domain in sim1a MO is denoted with asterisks, and the reduction in the ppargc1a domain in sim1a cRNA injected is denoted with arrowheads. Scale bars = 60 μm. (B) WISH for sim1a (purple) and smyhc (red) in 20 ss WT, ppargc1asa13186-/-, and ppargc1a cRNA injected zebrafish. Arrows and the dashed green line represent the beginning of the sim1a domain expression, the red dashed line indicate the end of the WT sim1a expression domain to illustrate the expansion of the segment boundary in ppargc1asa13186-/- is denoted with asterisks, and the reduction of the sim1a domain in ppargc1a cRNA injected is denoted with arrowheads. Scale bar = 40 μm. (C) WISH for trpm7 at 28 ss in WT, sim1a cRNA, and ppargc1a cRNA injected zebrafish. Scale bar = 50 μm (D) Absolute length measurements of the ppargc1a domain in 28 ss in WT, sim1a MO injected, and sim1a cRNA injected zebrafish. (E) Absolute length measurements of the 20 ss sim1a domain in WT, ppargc1asa13186-/-, and ppargc1a cRNA injected zebrafish. (F) Absolute length measurements of the trpm7 domain in the 28 ss WT, sim1a cRNA injected, and ppargc1a cRNA injected zebrafish. (G) WISH for trpm7 (PST segment) in WT, WT + sim1 a MO, ppargc1asa13186-/-, and ppargc1asa13186-/- + sim1a MO zebrafish. The green and red dashed lines indicate the beginning and end of WT trpm7 expression domains respectively. Asterisks represent expanded expression domain. Scale bars = 100 μm. (H) Absolute length measurements for the trpm7 domain in WT, sim1a MO injected, ppargc1asa13186-/-, and ppargc1asa13186-/- sim1a MO injected zebrafish. (I) Expression summary table depicting the segment boundaries and expression domains of ppargc1a and sim1a in WT, sim1a-deficient, ppargc1a-deficient, and double-deficient zebrafish. (J) Genetic model illustrating the relationships supported in this study that ppargc1a works upstream of tbx2b to form the DL and has a cross-repressive relationship with sim1a to properly form the segment boundary of the PST. Data are represented as ±SD, significant by t test, n.s. = not significant, *** = p < 0.001.
Image
Figure Caption
Figure Data
Acknowledgments
This image is the copyrighted work of the attributed author or publisher, and
ZFIN has permission only to display this image to its users.
Additional permissions should be obtained from the applicable author or publisher of the image.
Full text @ Elife

