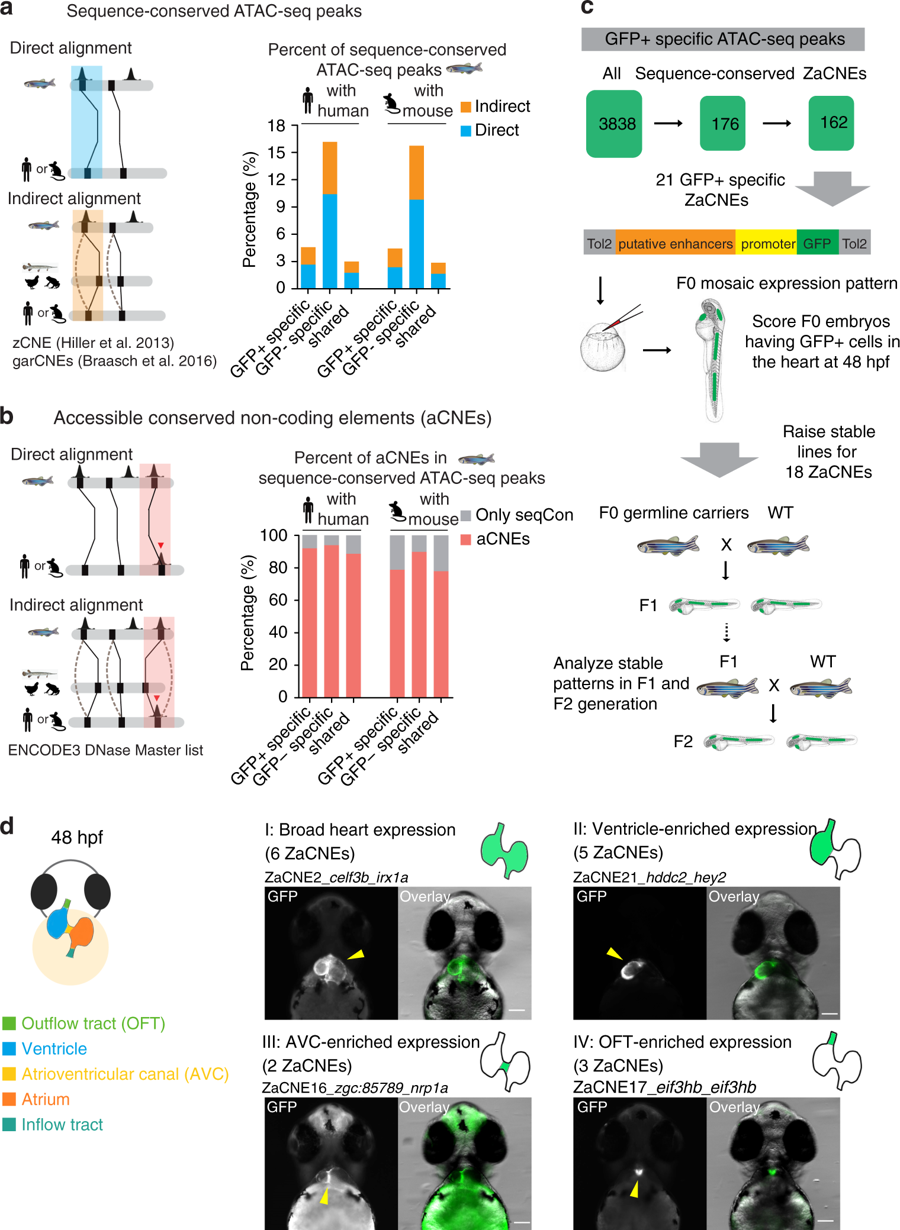
Fig. 3 Identification and in vivo characterization of accessible conserved non-coding elements (aCNEs). a Barplot showing the percentage of conserved regions in all GFP+ /− specific and shared ATAC-seq categories. Solid lines in the cartoon indicate direct sequence alignment and dotted lines showcases of indirect alignment bridged by intermediate species or ancestry reconstruction. b Barplot showing the aCNEs/sequenced conserved (seqCon) percentage. Most seqCon open chromatin regions were identified as having shared orthologous accessible chromatin. c Strategy for identifying and characterizing GFP+ specific aCNEs in zebrafish. Stable transgenic lines for 18 aCNEs were characterized. d Cartoon showing the zebrafish heart anatomy at 48 hpf (left panel). Heart expression patterns observed in ZaCNEs transgenic lines were classified into 4 categories (right panel), including I: broad expression in the whole heart; II: ventricle-enriched expression; III: atrioventricular (AVC)-enriched expression; IV: outflow tract (OFT)-enriched expression. One representative example of each category was shown and the numbers of ZaCNEs fall in each category are indicated in the brackets. The two closest genes near each ZaCNEs are indicated. All images were taken from the ventral view and all scale bars represent 100 μm
Image
Figure Caption
Acknowledgments
This image is the copyrighted work of the attributed author or publisher, and
ZFIN has permission only to display this image to its users.
Additional permissions should be obtained from the applicable author or publisher of the image.
Full text @ Nat. Commun.

