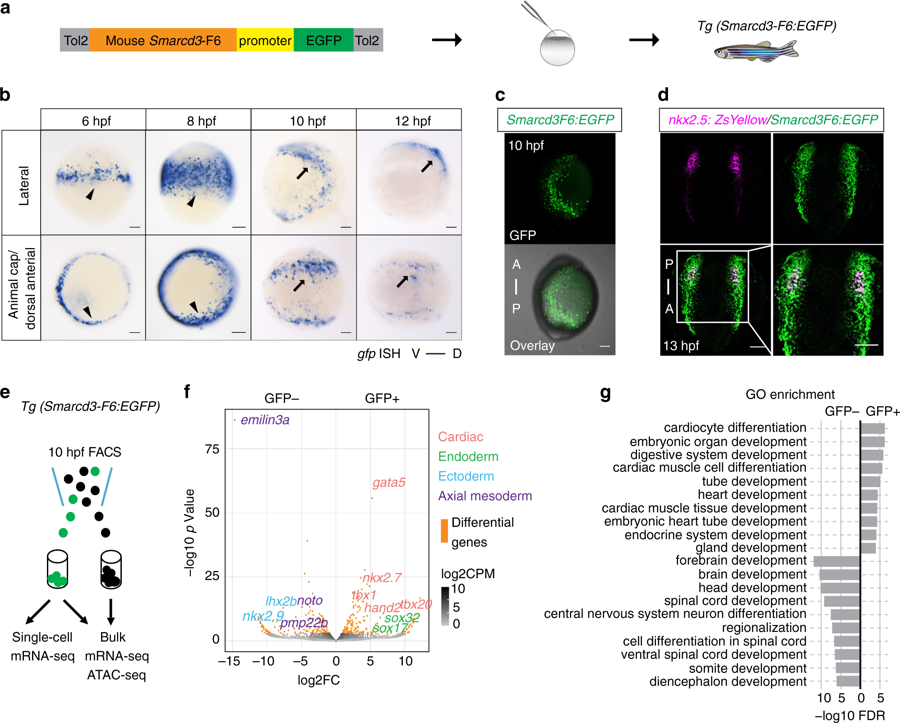
Fig. 1 Mouse Smarcd3-F6 enhancer labels early cardiac progenitors in zebrafish. a Generation of Tg(Smarcd3-F6:EGFP) zebrafish line b In-situ hybridization against gfp transcripts on Tg(Smarcd3-F6:EGFP) transgenic embryos. Smarcd3-F6 enhancer marks lateral margins (arrowheads) during gastrulation and ALPM regions (arrows) after gastrulation. c Native GFP expression in Tg(Smarcd3-F6:EGFP) embryos at 10 hpf. Embryos are shown in lateral views. d Immunostaining of GFP and ZsYellow on Tg(Smarcd3-F6:EGFP) and Tg(nkx2.5:ZsYellow) double transgenic embryos. Cells expressing ZsYellow were marked by GFP as well. e Workflow of mRNA-seq and ATAC-seq experiments. f Volcano plot showing genes differentially expressed between Smarcd3-F6:GFP+ and Smarcd3-F6:GFP- populations (FDR < 0.05, absolute log2FC > 1). g Top 10 most enriched GO terms obtained from genes that were significantly more highly expressed in Smarcd3-F6:GFP+ or Smarcd3-F6:GFP- populations. All scale bars represent 100 μm
Image
Figure Caption
Figure Data
Acknowledgments
This image is the copyrighted work of the attributed author or publisher, and
ZFIN has permission only to display this image to its users.
Additional permissions should be obtained from the applicable author or publisher of the image.
Full text @ Nat. Commun.

