Fig. 7
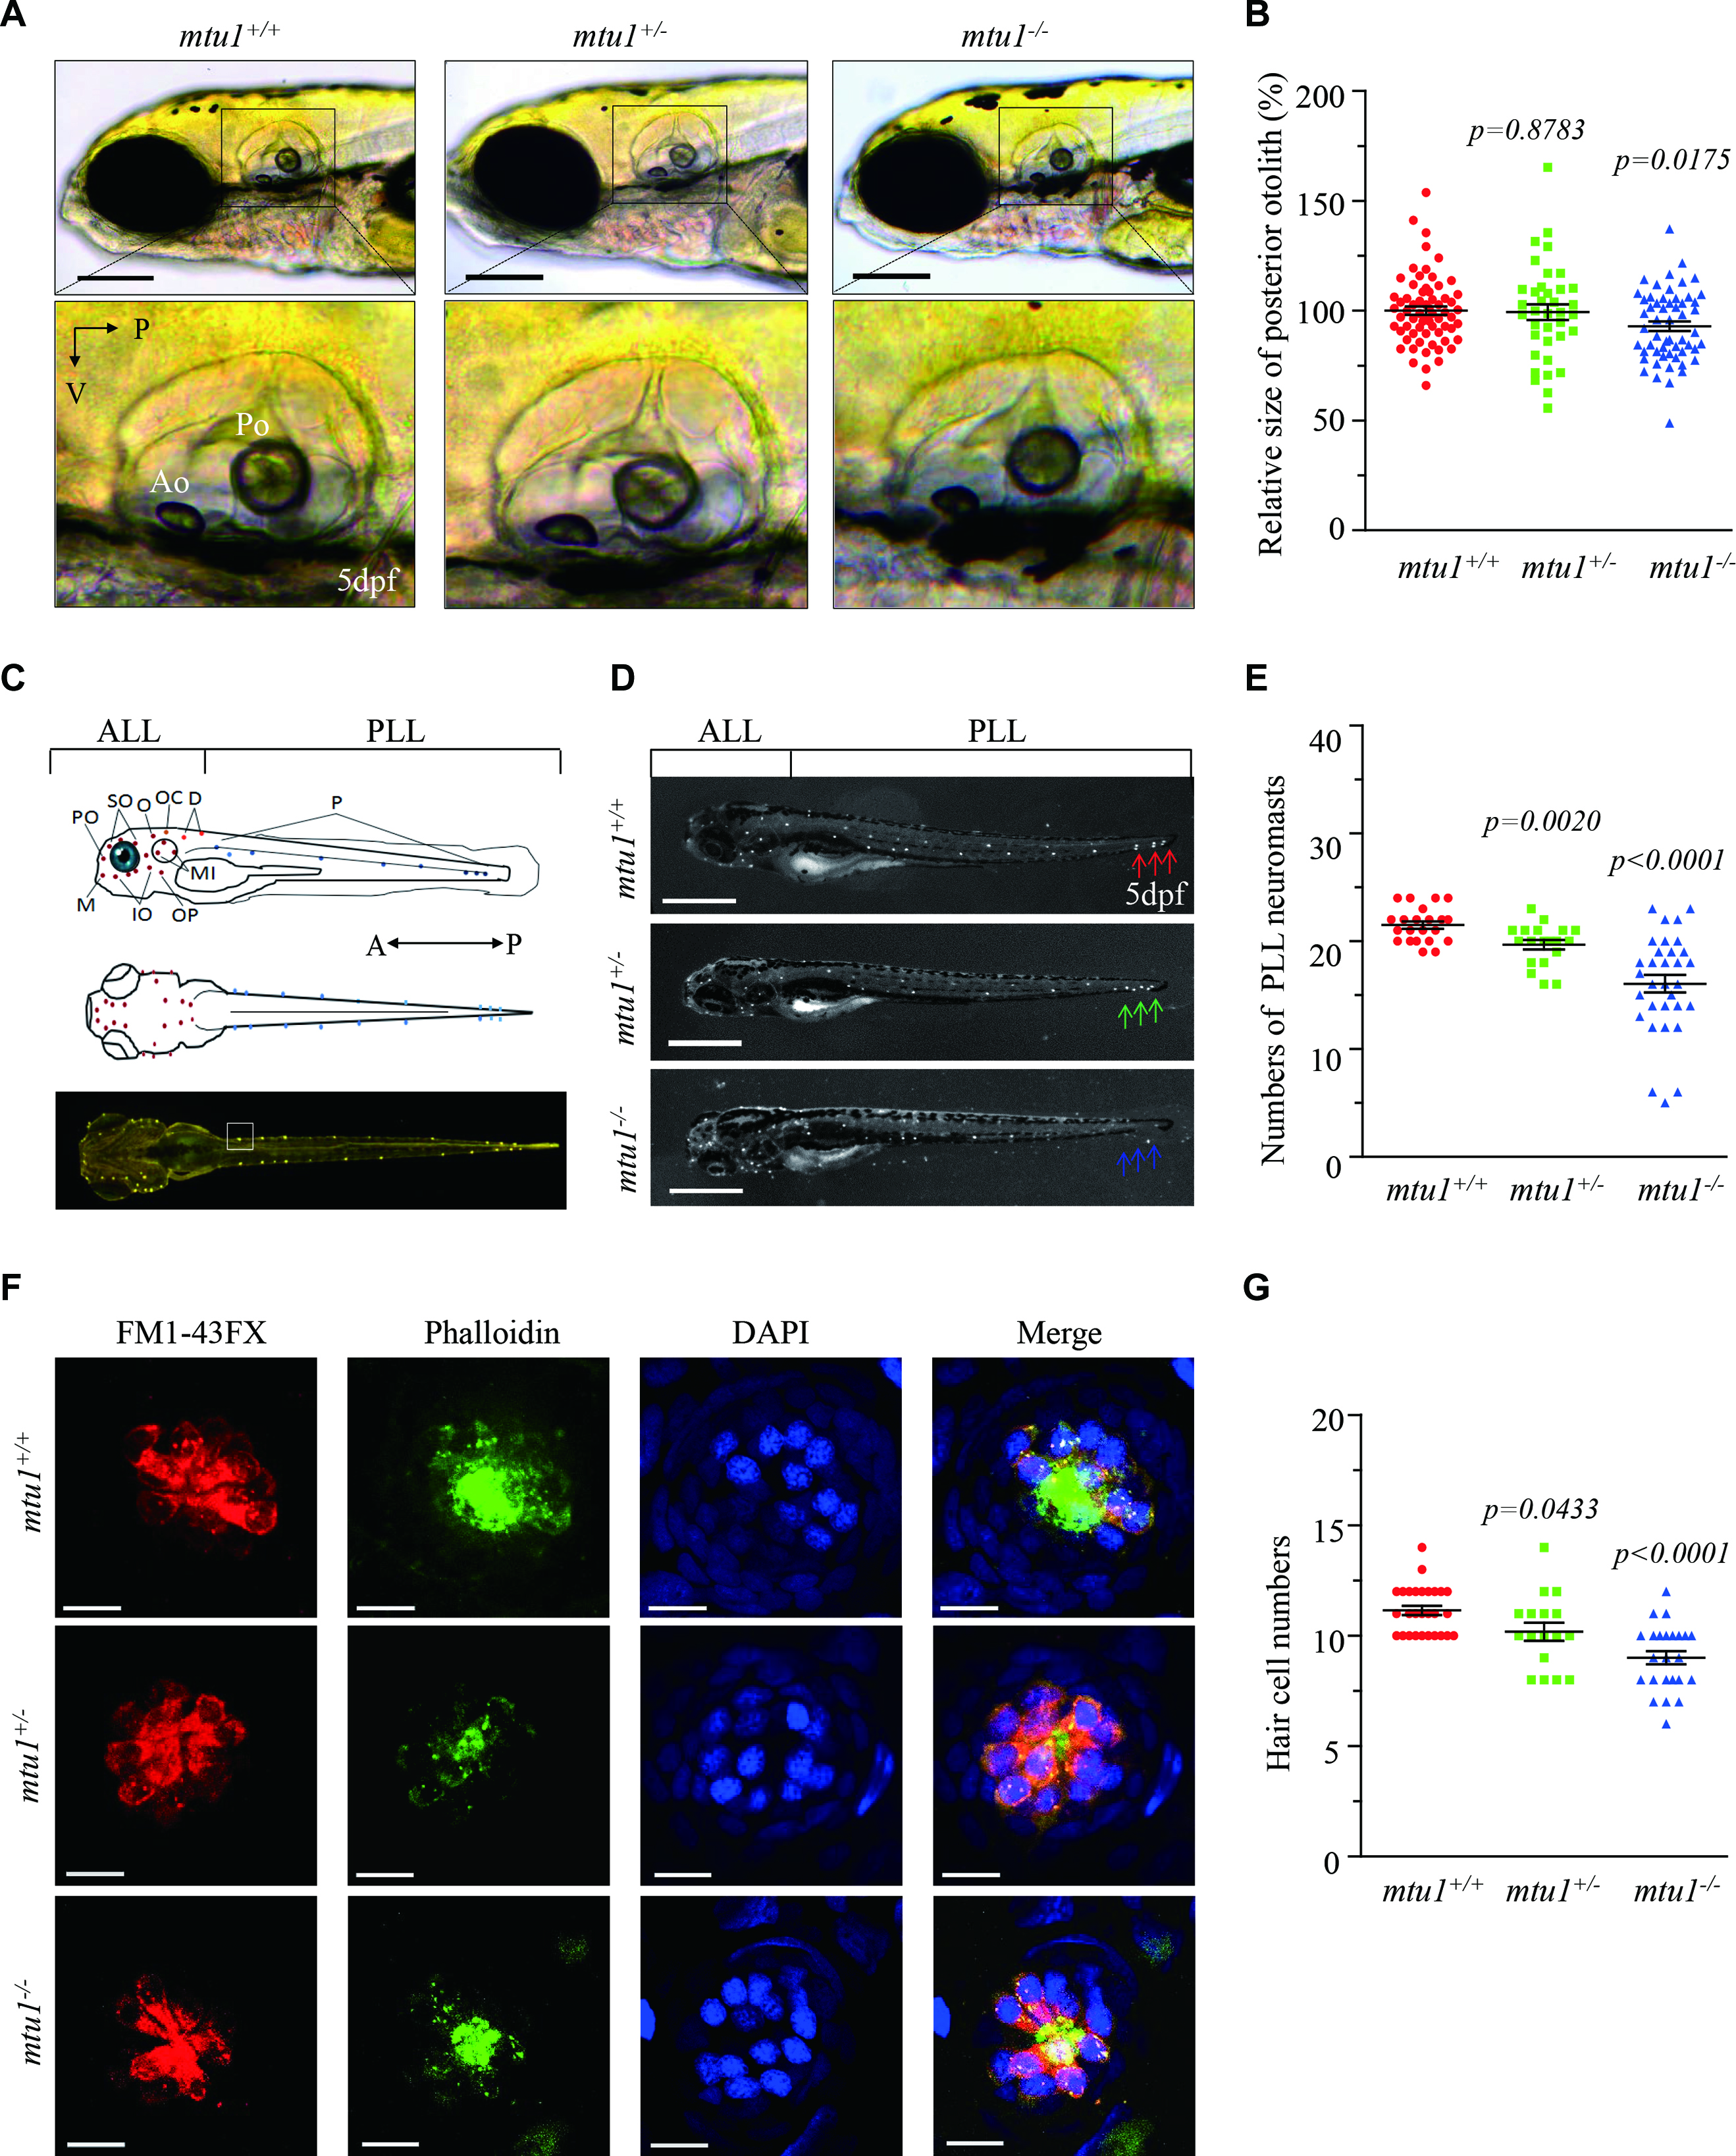
Defects in hearing organs in zebrafish at 5 dpf. (A) Otolith morphologies of mtu1−/−, mtu1+/− and mtu1+/+ zebrafish were illustrated under a Leica microscope with an objective magnification of 20 X. Lateral views of the otic vesicle were shown in the low arrows. V, ventral; P, posterior. (B) Quantification of sizes of posterior otolith in the mtu1−/−(n = 98), mtu1+/− (n = 95) and mtu1+/+ (n = 99) zebrafish. (C) Lateral and dorsal views of zebrafish larvae show the distribution of neuromasts along the body. A, anterior; P, posterior. (D) Larval of mtu1−/−, mtu1+/− and mtu1+/+ zebrafish were fluorescently labeled with FM1-43FX and observed under a stereoscopic microscope with an objective magnification of 20 X. Neuromast numbers of anterior lateral line (ALL) and posterior lateral line (PLL) in mutant and wild type fishes were counted, respectively. The arrows indicated the positions where the number of neuromasts were significantly reduced in the mutant fishes. (E) Quantification of neuromasts numbers of posterior lateral line (PLL) from the mtu1−/−, mtu1+/− mutant and wild type zebrafish. The calculations were based on the numbers of mtu1−/− (n = 32), mtu1+/− (n = 20) and mtu1+/+ (n = 21) larvae. (F) The hair cells, stereocilia and nuclei of neuromas from mutant and wild type zebrafish were stained with FM1-43FX (red), phalloidin (green) and DAPI (blue), respectively. Scale bars = 10 μm. (G) Quantification of numbers of hair cells for the mtu1−/−(n = 25), mtu1+/− (n = 17) and mtu1+/+ (n = 28) zebrafish. Graph details and symbols are explained in the legend to Figure 3.

