
|
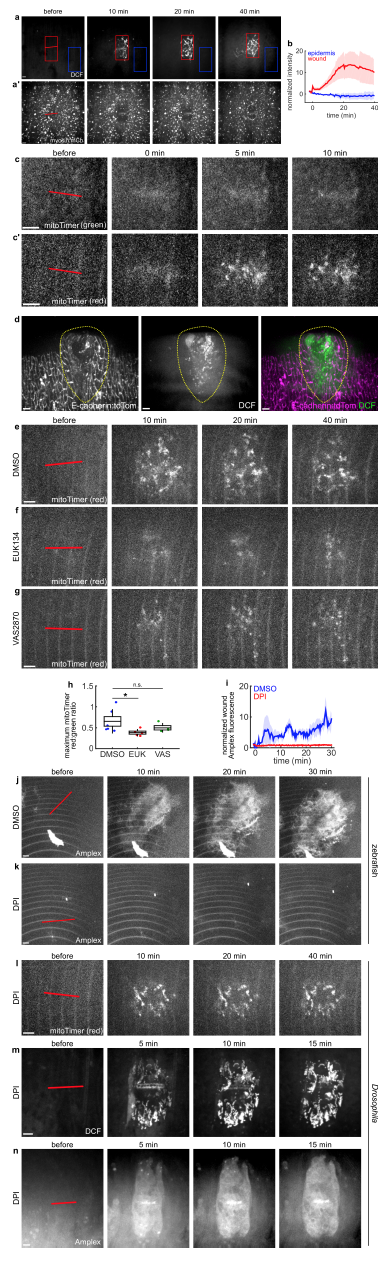
Fig. S1
Mitochondrial ROS are produced as a result of tissue damage.
(a) Wound closure in the epidermis of a Drosophila embryo injected with H2DCFDA, a membrane-permeable ROS dye (a), and expressing myosin:mCherry (a’). Red and blue boxes outline the regions used to quantify epidermal fluorescence in (b). (b) Mean DCF fluorescence over time inside the wound (red, n = 5) and in the surrounding epidermis (blue, n = 5). Note that negative intensities indicate fluorescence values below the background (the image mode). (c) Wound closure in the epidermis of a Drosophila embryo expressing mitoTimer, a mitochondrial ROS biosensor that contains a mitochondrially targeted dsRed variant whose fluorescence shifts from green (c) to red (c’) upon oxidation. (d) Epidermal cells in a Drosophila embryo expressing E-cadherin:tdTomato in embryos injected with DCF and subsequently impaled using the injection microneedle. Images were acquired ~5 minutes after wounding. Yellow dotted lines outline the wound. Scale bars, 5 μm. (e-g) mitoTimer fluorescence (red signal) in the epidermis of a Drosophila embryo injected with DMSO (e), the superoxide dismutase mimetic EUK134 (f), or the NADPH oxidase inhibitor VAS2870 (g). (h) Maximum red:green mitoTimer fluorescence ratio inside the wound for embryos injected with DMSO (blue, n = 6 wounds), EUK134 (green, n = 5), or VAS2870 (yellow, n = 4). Horizontal line, mean; box, SEM; error bars, standard deviation (SD). *, P < 0.05; n.s., not significant. (i) Mean Amplex UltraRed fluorescence inside the wound for zebrafish embryos treated with DMSO (blue, n = 5 wounds) or the ROS inhibitor DPI (red, n = 3). (b, i) Error bars, SEM. (j-k) Amplex Ultrared fluorescence in the enveloping layer of wounded zebrafish embryos treated with DMSO (j) or with the ROS inhibitor DPI (k). Time after wounding is indicated. Red lines indicate wound sites. Scale bars, 10 μm. (l-n) Epidermal cells in Drosophila embryos injected with DPI and expressing mitoTimer (l, red signal shown), or co-injected with H2DCFDA (m) or Amplex Ultrared (n). (a, c, e-g, j-n) Anterior left, dorsal up. Red lines indicate wound sites. Scale bars, 5 μm.
Reprinted from Developmental Cell, 47, Hunter, M.V., Willoughby, P.M., Bruce, A.E.E., Fernandez-Gonzalez, R., Oxidative Stress Orchestrates Cell Polarity to Promote Embryonic Wound Healing, 377-387.e4, Copyright (2018) with permission from Elsevier. Full text @ Dev. Cell