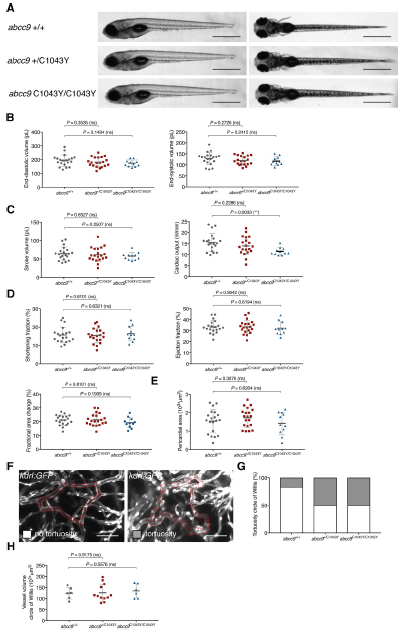
Fig. S11
abcc9[C1043Y] embryos show torturous cerebral vessels at 5 dpf. (A) Comparison of wildtype and abcc9[C1043Y] mutants at 5 dpf seen from a left lateral (left) and dorsal view (right). (B-D) Quantification of cardiac function using sequential still frames from high-speed of the embryonic cardiac cycle at 5 dpf. Ventricular volume (B), cardiac output (C) and contractile function (D) were calculated. (E) Quantification of pericardial edema by measuring pericardial area using striking morphological landmarks. In order to correct for possible enlarged ventricular size in mutants, ventricular area was subtracted. (F) Representative confocal images of circular structure comprised of BCA and PCS in wild type and mutant 5 dpf fish are highlighted in red. (G) Quantification of phenotype shown in (F) in heterozygous, homozygous and wildtype siblings, (H) Quantification of vascular dilations in a Tg(kdrl:GFP) background. 3D reconstruction of vascular structure in Imaris was used to calculate vessel volume. For all graphs, significance was determined by two-tailed unpaired Student's t test: * p≤0.05; ** p≤0.01; *** p≤0.001; **** p≤0.0001. The black horizontal bar indicates the mean value for each condition. Sample size, abcc9+/+, n=20; abcc9+/C1043Y, n=20; abcc9C1043Y/C1043Y, n=11 in B-E; abcc9+/+, n=6; abcc9+/C1043Y, n=12; abcc9C1043Y/C1043Y, n=5 in G-H. Scale bar, 1 mm in A, 50 μm in F. All embryos analyzed originated from group matings of adult zebrafish.

