
|
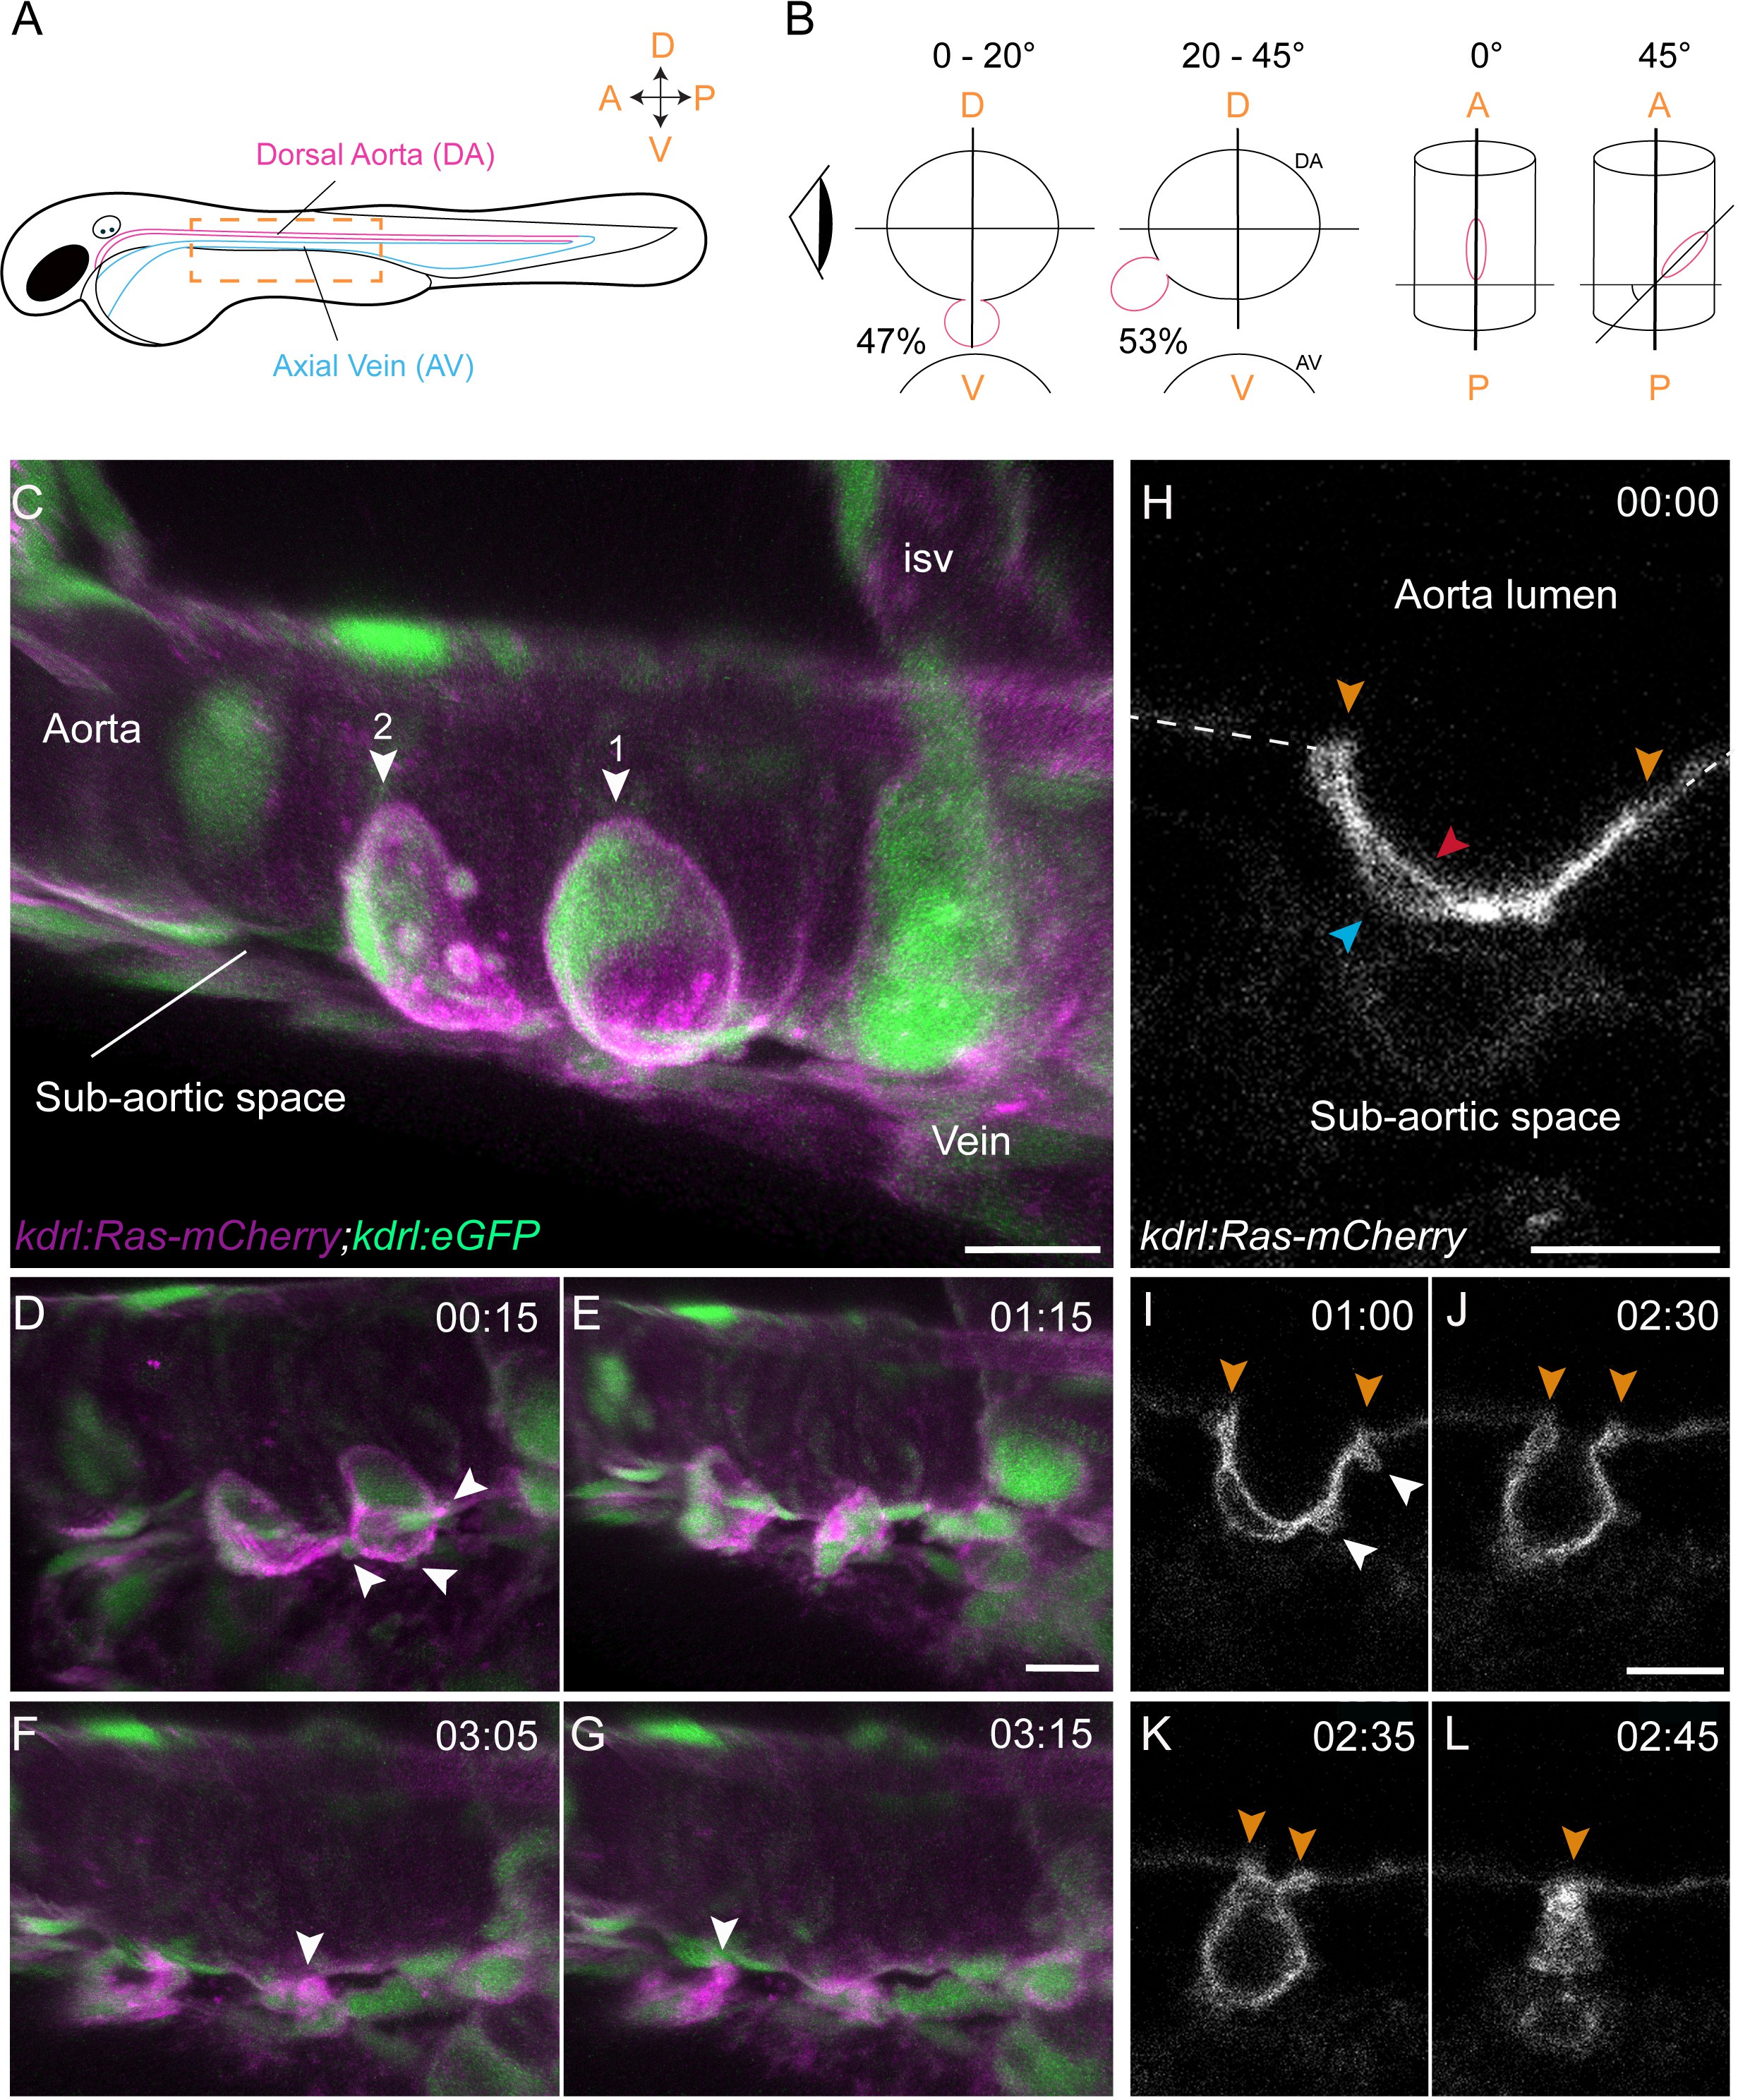
Fig. 1
Sequential steps and morphological changes during the EHT
(A–B) The EHT is variable in space and time. Schematic representations of (A) a zebrafish embryo at 48 hpf; a yellow rectangle shows the region of imaging. (B) Left, transversal sections of the dorsal aorta showing the % of cells undergoing emergence (in red) at 0°−20° or 20°–45° angle relative to the dorso-ventral axis (N = 49 cells). The eye looks in the direction of imaging. Right, top view showing variation of the angle of emergence (with the A-P axis as reference). Note that the EHT is also characterized by variability in its time-length, see Figure 1—figure supplement 1 and main text. (C–L) Live confocal images from 48 hpf Tg(kdrl:Ras-mCherry; kdrl:eGFP) embryos. (C–G) Images extracted from a 3D-rendering TL sequence (D–G) and a Z-stack acquired 120 min before initiation of the time-lapse (C), showing the typical changes of cell shape during the EHT (see Figure 1—video 1). (C) Numbered arrowheads: rim of two cup-shaped EHT undergoing cells. Arrowheads indicate blebs in (D) and cellular foots in (F and G). isv: intersegmental vessel (see also Figure 1—video 1). (H–L) Single Z-planes corresponding to cell #2 extracted from the same TL sequence. Arrowheads: cell borders connecting with adjoining endothelial cells (in yellow), the luminal membrane (in red), the basal membrane (in blue), and blebs (in white), respectively (see Figure 1—video 2). Time is indicated in hrs:min. Scale bars, 10 μm.