
|
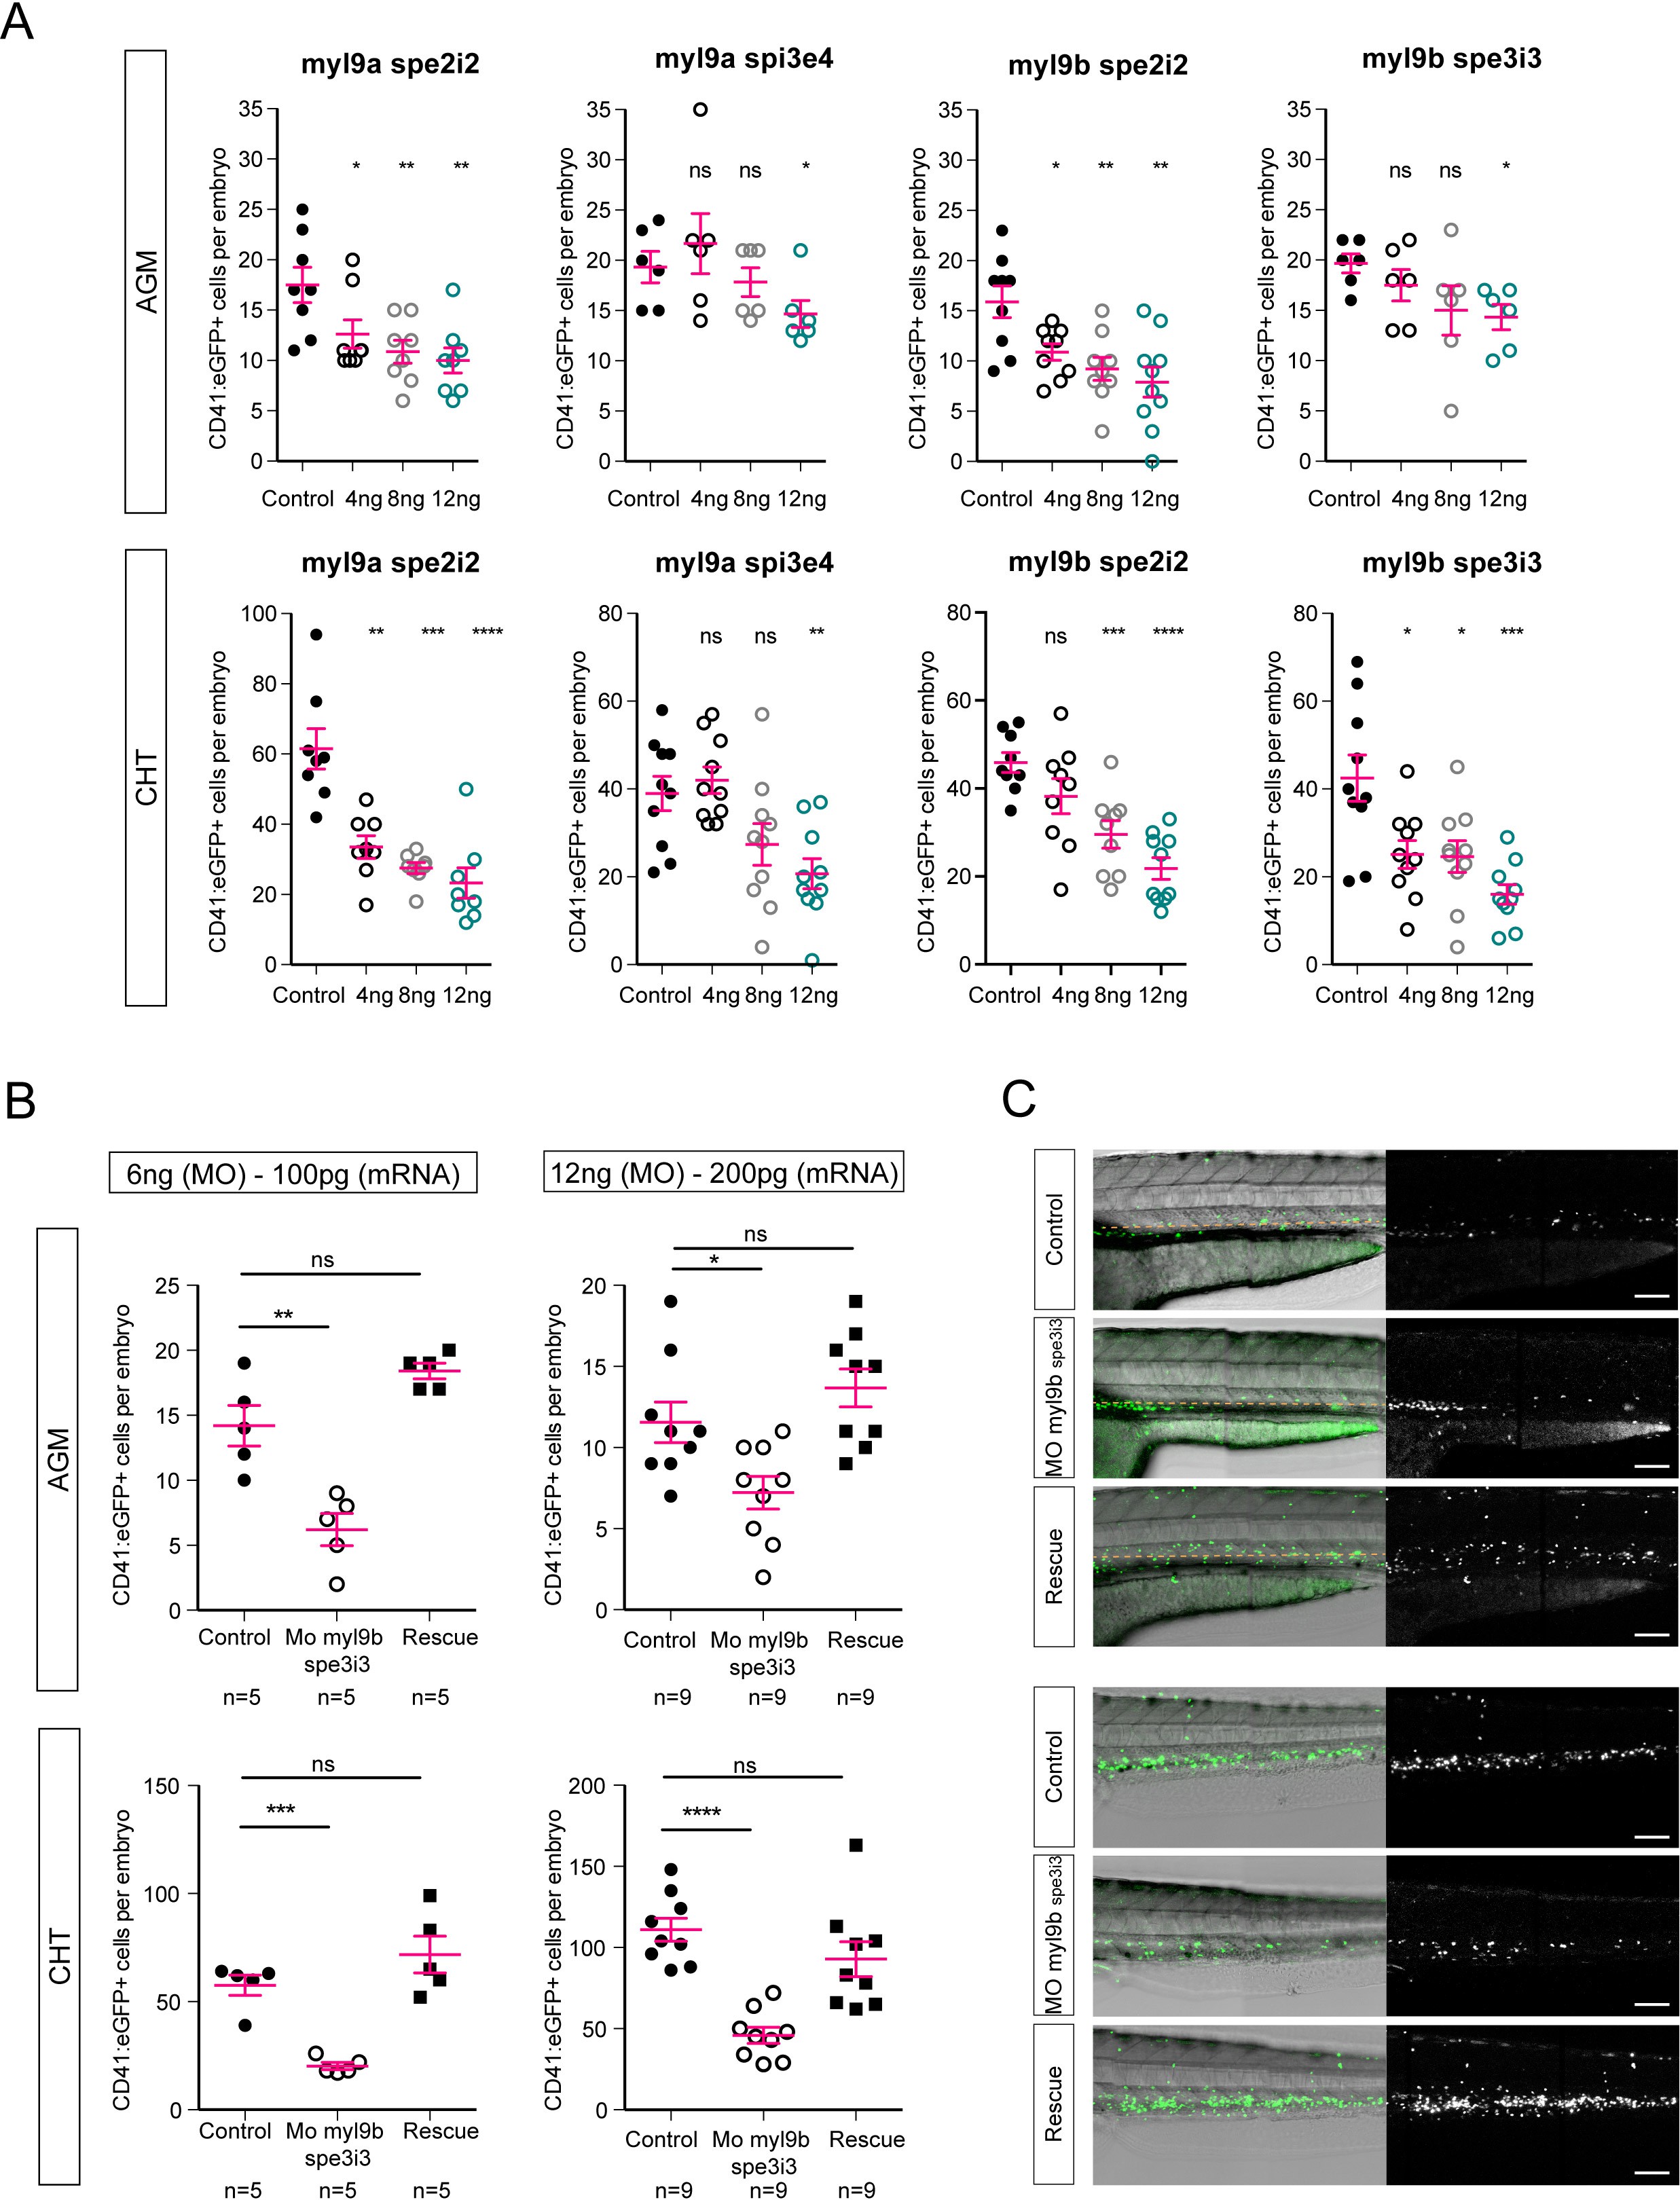
Fig. 8-S2
Myl9a and myl9b morpholinos phenocopy of hematopoietic phenotype and myl9b morpholino rescue.
(A) CD41:eGFP positive cell numbers in the AGM (top panel) and the CHT (bottom panel) after myl9a and myl9b morpholinos at the concentrations of 4, 8 and 12 ng. (B) CD41:eGFP positive cell numbers in the AGM (top panel) and the CHT (bottom panel) after injections of 100 pg (left panel, n = 5) and 200 pg (right panel, n = 9) of myl9b mRNAs (rescue). (C) Maximum projection of Z-planes obtained from 50 hpf Tg(CD41:eGFP) embryos, focusing either on the AGM region (top panel), or on the CHT (bottom panel). Only the CD41:eGFPpositive cells above the yellow dashed line were counted (top panel), as those beneath are not necessarily hematopoietic cells (Kissa et al., 2008). Red bars represent Mean ± SEM. (*) p<0.05; (**) p<0.01; (***) p<0.001; (****) p<0.0001.