
|
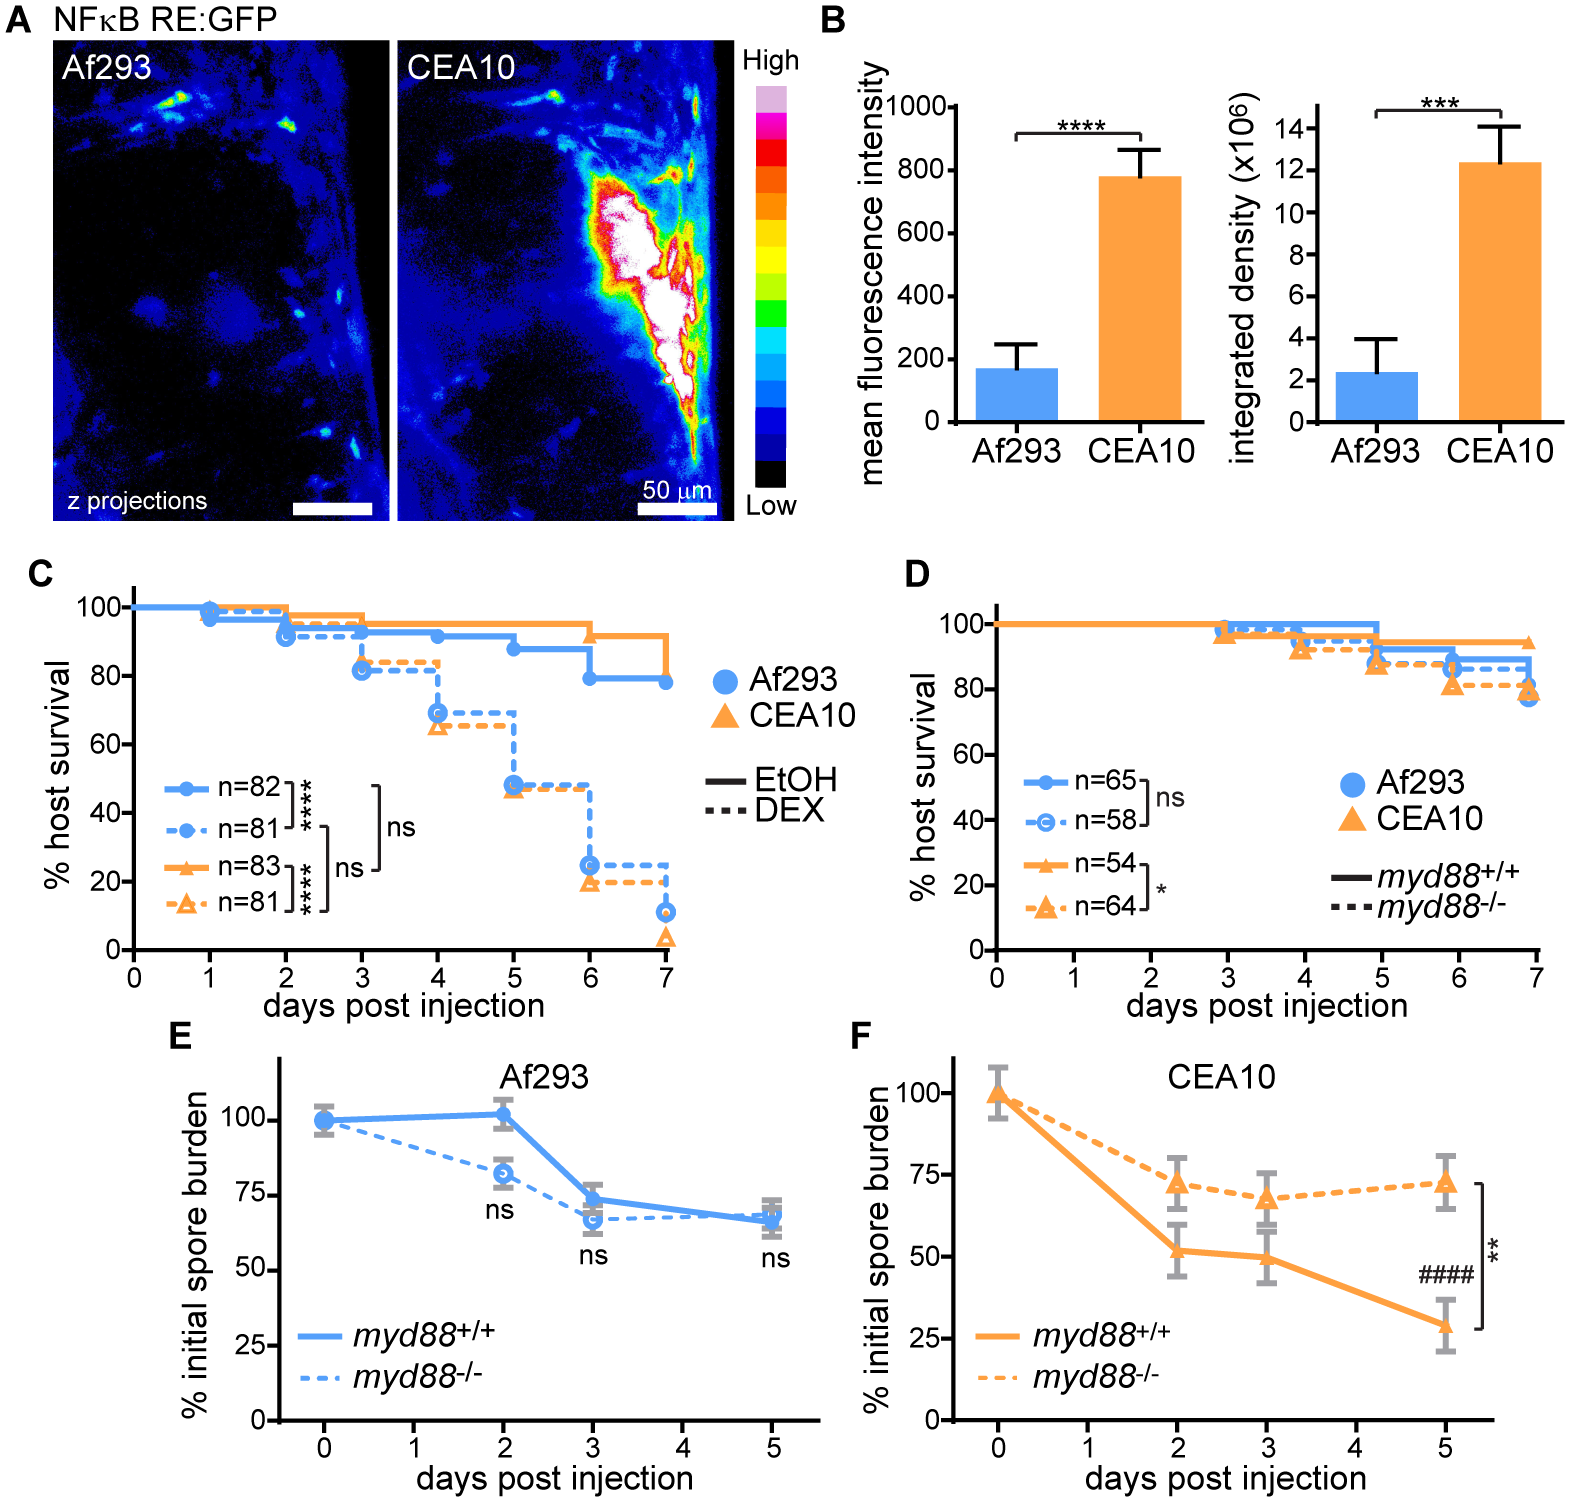
Fig. 2
Inflammatory activation is required for clearance of a CEA10-derived strain.
A, B. NF-κB RE:EGFP larvae were infected with non-fluorescent TJW55.2 (Af293) or CEA17 KU80Δ (CEA10) spores and imaged 2 dpi. Representative images (A) and quantification from three pooled experiments (B) are shown. Scale bar represents 50 μm. CEA10 n = 22; Af293 n = 26. C. Larvae were treated with dexamethasone (DEX) or ethanol (EtOH) vehicle control directly after infection with TFYL81.5 (Af293) or TFYL49.1 (CEA10), and larval survival was monitored. Average injection CFUs: Af293 = 34, CEA10 = 33. D-F. myd88-/- or control larvae were infected with TBK1.1 (Af293) or TFYL49.1 (CEA10) and larval survival and/or fungal burden was monitored. Fungal burden was determined by CFU platings from single homogenized larvae. Asterisks represent significance between myd88-/- and control larvae, # represent significance compared to day 0. Average injection CFUs: D, F: Af293 = 27, CEA10 = 32; E: Af293 = 66. For all analyses, data represent 3 pooled replicates. For CFU experiments, CFUs from 24 larvae (8 larvae per replicate) per condition per day were measured. Intensity values and CFU analyses represent lsmeans ± SEM from three pooled experiments, P values calculated by ANOVA. P values for survival analyses calculated by Cox proportional hazard regression analysis. See also S2 Fig.