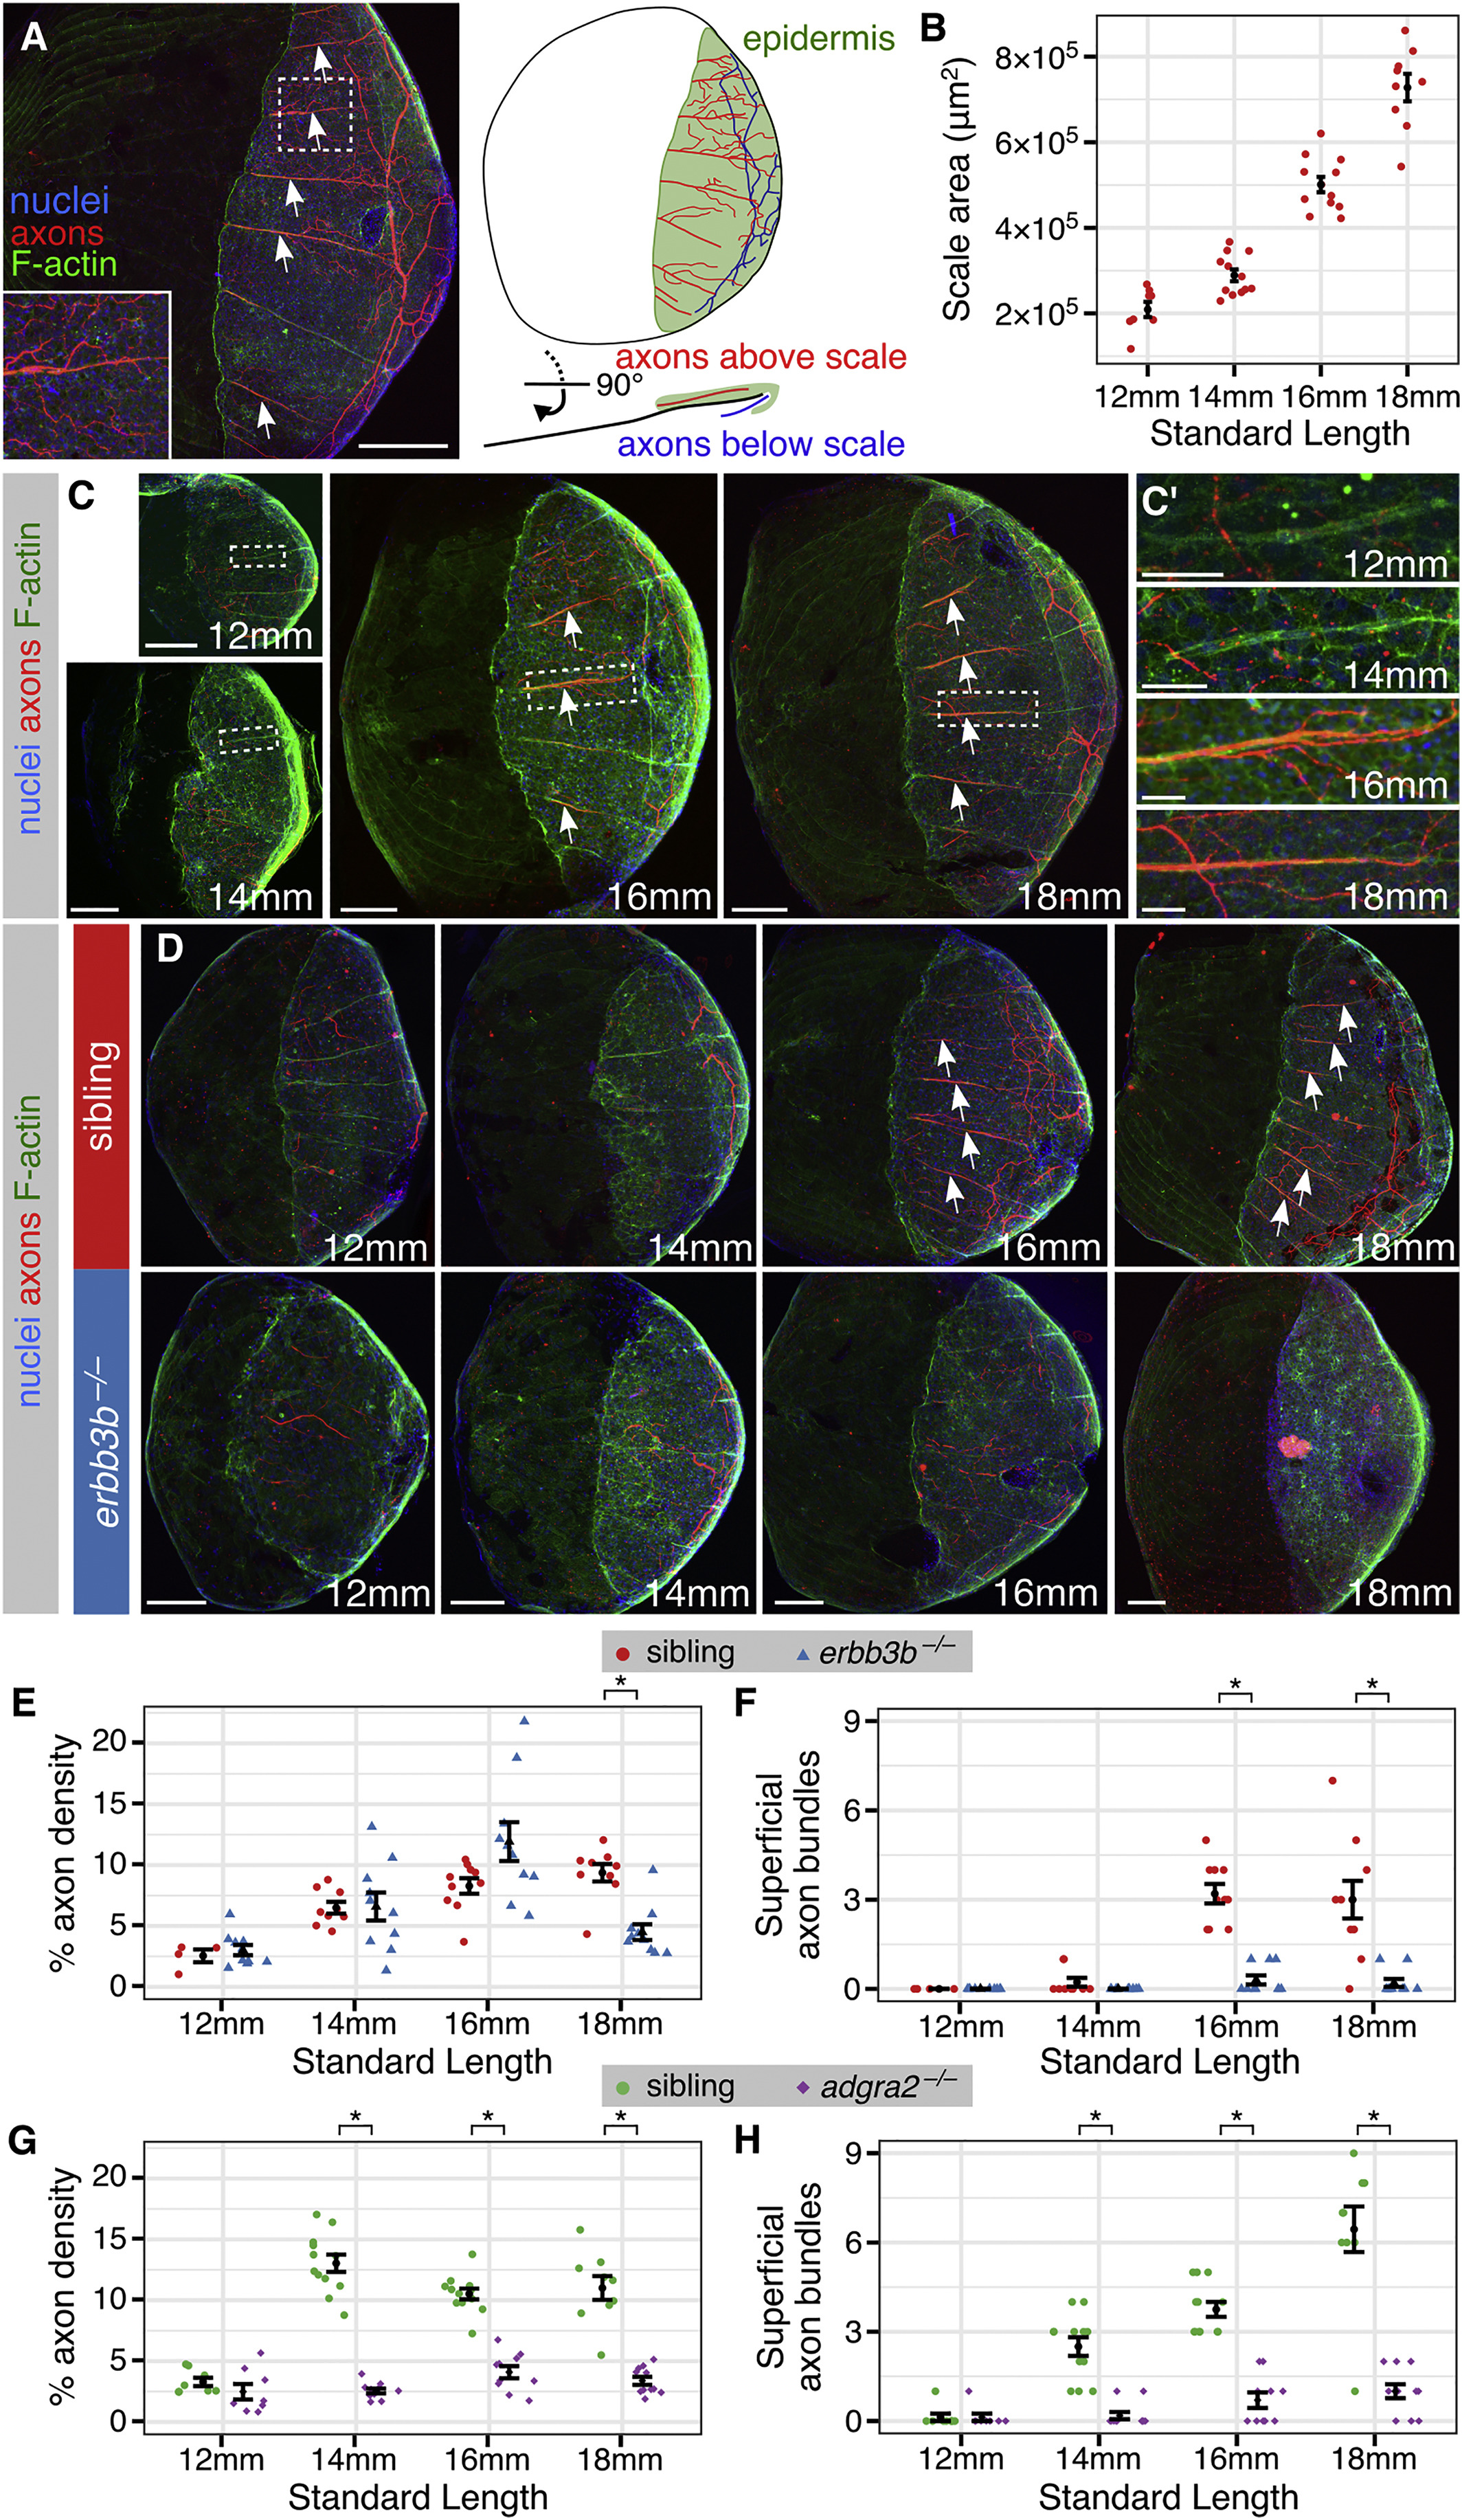
Fig. 2
Remodeling of Skin Innervation during Juvenile Development
(A) Adult scale removed from animal and immunostained for indicated structures. Note that the posterior region is covered by epidermis (green).
(B) Measurements of scale size during late juvenile stages. n = 8–12 scales/stage. Black bars, mean ± SEM.
(C) Representative scales from juvenile animals immunostained at the indicated stages. Magnifications of epidermis are shown in C′. Note that elongated tracts form before nerves enter the scale.
(D) Representative scales from juvenile erbb3b−/− and sibling controls. Note that in erbb3b−/− scales axon bundles never form, and innervation is lost by 18 mm SL. Arrows in (A), (C) and (D) indicate superficial axon bundles.
(E–H) Quantification of axon density near the skin (E and G) and superficial axon bundles (F and H) based on acTubulin staining. n = 4–12 scales/sample (mean sample size = 9.7). Black bars, mean ± SEM. ∗p < 0.01, Wilcoxon rank-sum test.
Staining: (A, C, and D) F-actin (phalloidin), axons (acTubulin) and nuclei (DAPI). Scale bars, 250 μm (A), 100 μm (C and D), and 25 μm (C′). See also Figure S3.
Reprinted from Developmental Cell, 46(3), Rasmussen, J.P., Vo, N.T., Sagasti, A., Fish Scales Dictate the Pattern of Adult Skin Innervation and Vascularization, 344-359.e4, Copyright (2018) with permission from Elsevier. Full text @ Dev. Cell

