Fig. S9
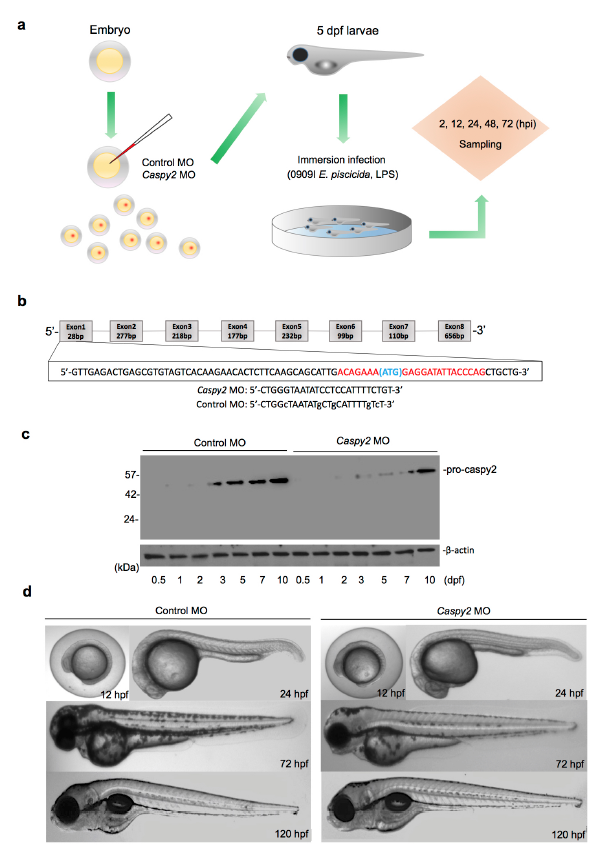
Representation of the zebrafish larvae immersion Infection Model.
(a) The zebrafish microinjection and immersion infection procedures. (b) Generation of caspy2 morphant zebrafish by morpholino oligonucleotide (MO)-mediated knockdown. The upper diagram shows the region of caspy2 targeted to block translation. (c and d) Analysis of the phenotypes of caspy2-MO- and control-MO-injected larvae. (c) Immunoblotting of caspy2 expression in morphants and controls up to 5 days post fertilization (dpf). (d) Representative images of the phenotypes of caspy2-MO- and control-MO-injected zebrafish up to 120 h post fertilization (hpf). (c and d) Results are representative of at least three independent experiments.

