Fig. 5
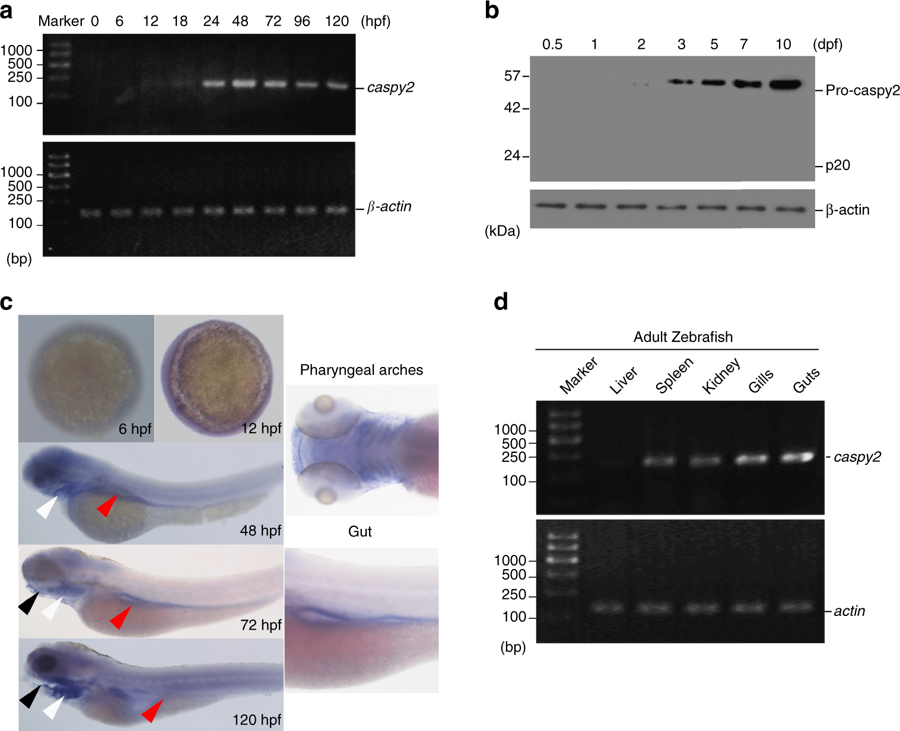
Pattern of caspy2 expression in zebrafish. a Reverse transcription polymerase chain reaction (RT-PCR) analysis of relative caspy2 expression at various stages of development. b Immunoblotting analysis of caspy2 levels at various stages of whole larvae development. c Whole-mount in situ hybridization targeting caspy2 mRNA in zebrafish at the developmental stages indicated. Black arrowheads, mouth; white arrowheads, pharyngeal arches; red arrowheads, gut. d RT-PCR analysis of relative caspy2 expression in the indicated adult zebrafish organs. a–d Results are representative of at least three independent experiments

