
Fig. 1
|
Fig. 1
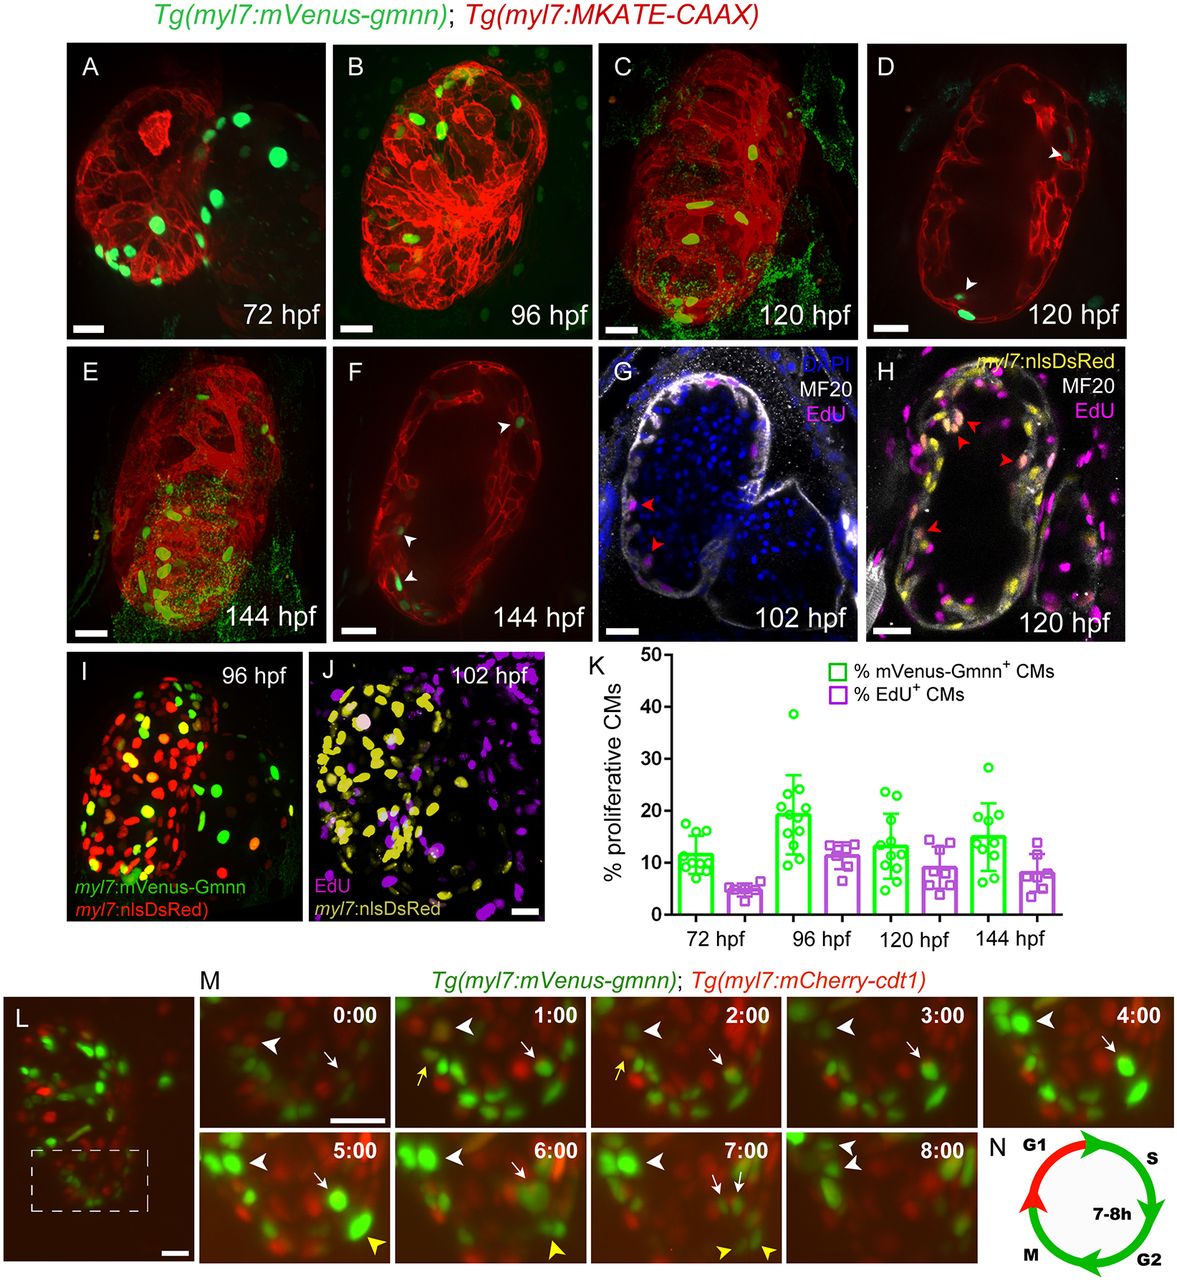
Tg(myl7:mVenus-Gmnn) expression marks proliferating cardiomyocytes in zebrafish. (A-F) Distribution of myl7:mVenus-Gmnn+ cardiomyocytes at several developmental stages. Tg(myl7:MKATE-CAAX) expression labels cardiomyocyte membranes. (A-C,E) Three-dimensional reconstructions; (D,F) cross-sections through the ventricle; white arrows point to trabecular mVenus-gmnn+ cardiomyocytes. (G) Cross-section of a 102 hpf heart stained for EdU and myosin heavy chain (MHC), to mark cardiomyocytes, after 6 h of EdU incubation. The location of EdU+ cardiomyocytes in the trabeculae is similar to that of myl7:mVenus-Gmnn+ cardiomyocytes (F,G; red arrowheads). (H) Cross-section of a 120 hpf Tg(myl7:nls-DsRed) heart stained for EdU, MHC and DsRed after 24 h of EdU incubation. Red arrowheads point to EdU+ cardiomyocytes in the trabecular layer. (I) Three-dimensional reconstruction of a 96 hpf Tg(myl7:mVenus-gmnn); Tg(myl7:nlsDsRed) heart. (J) Three-dimensional reconstruction of a 102 hpf Tg(myl7:nlsDsRed) heart stained for EdU and DsRed after 6 h of EdU incubation. (K) Percentage of proliferating cardiomyocytes at several developmental stages, as assessed with the Tg(myl7:mVenus-gmnn) line or EdU labeling (6 h) (data are presented as mean±s.d.). (L) Three-dimensional reconstruction of a 96 hpf Tg(myl7:mVenus-gmnn); Tg(myl7:mCherry-cdt1) heart that was temporarily stopped to follow the progression of the cardiomyocyte cell cycle. (M) Higher magnification of the ventricular area of the 96 hpf Tg(myl7:mVenus-gmnn); Tg(myl7:mCherry-cdt1) heart shown in L followed over 10 h. White arrowheads point to a cardiomyocyte that transits from a myl7:mVenus-Gmnn−; myl7:mCherry-Cdt1+ state at t=0:00 to a myl7:mVenus-Gmnn+; myl7:mCherry-Cdt1− state, with completed nuclear division at t=8:00 h. White arrows point to a cardiomyocyte that has started expressing myl7:mVenus-Gmnn at t=0:00 h and completes nuclear division at t=7:00 h. Yellow arrowheads point to additional examples of dividing cardiomyocytes (from t=5:00 to t=7:00); yellow arrows point to a cardiomyocyte losing mVenus-Gmnn signal. (N) Estimation of the duration of the S-G2-M phase (green) based on time-lapse imaging. Scale bars: 20 µm (bar in J applies to I).