
|
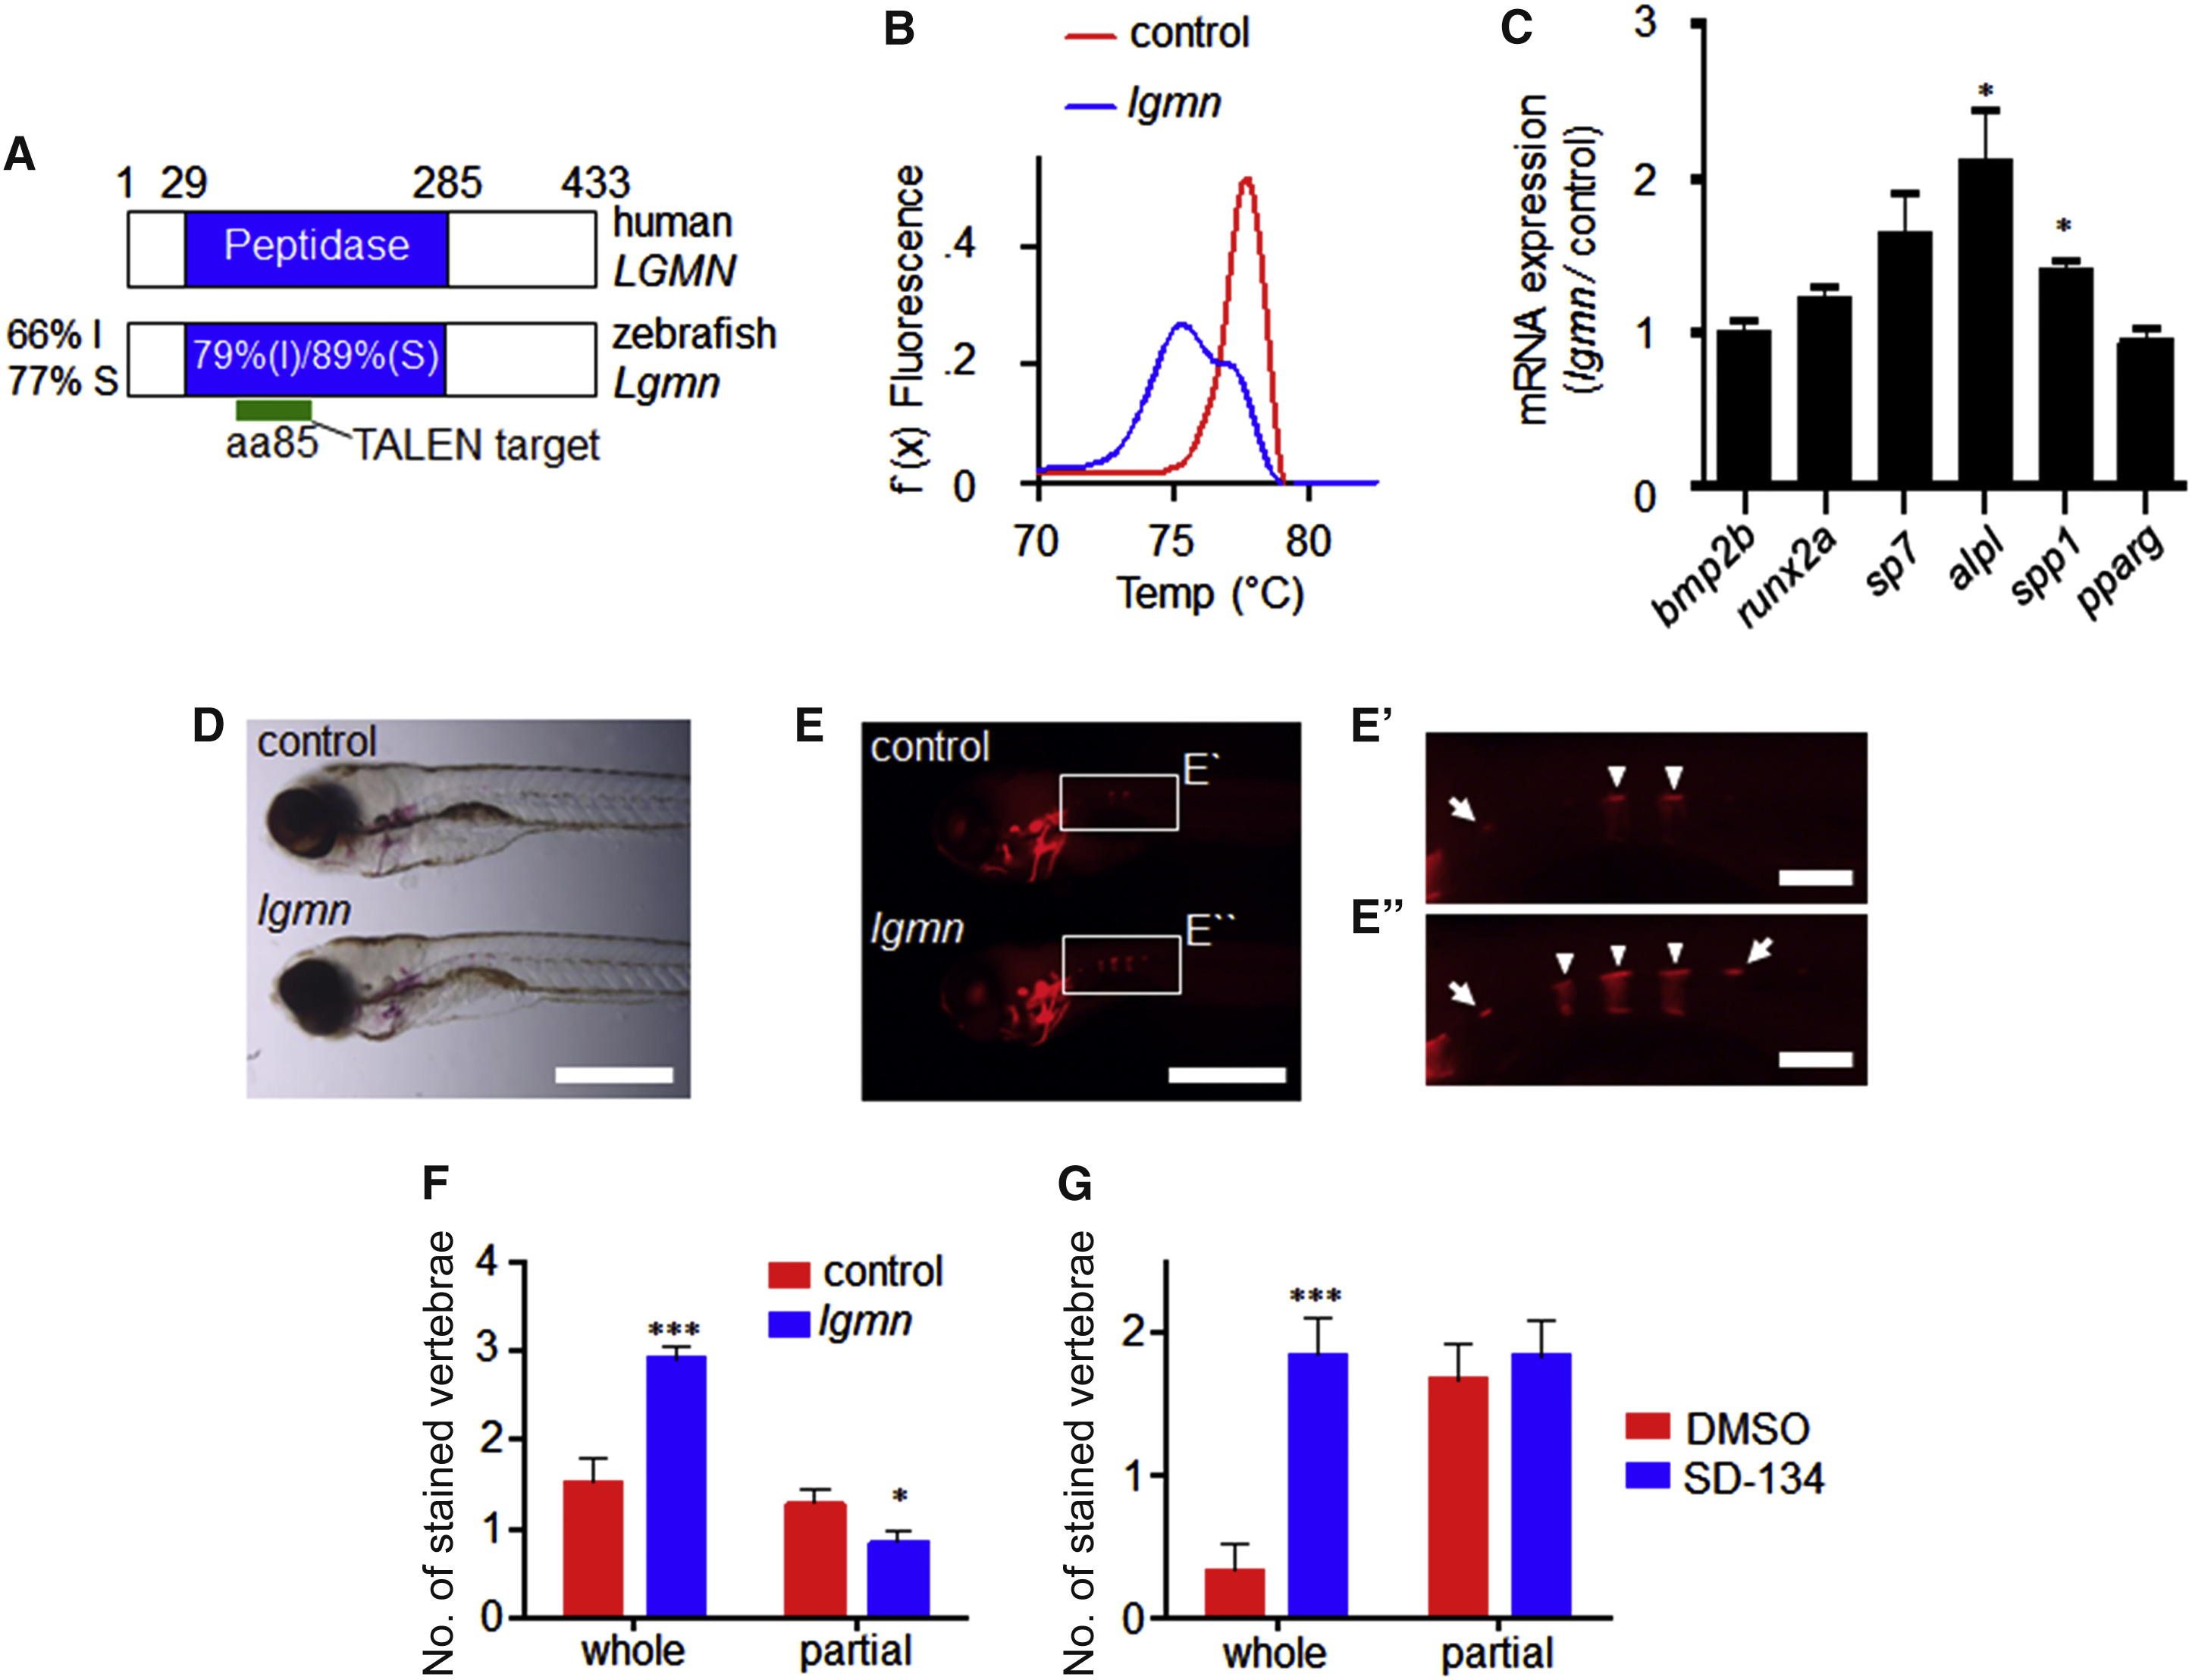
Fig. 5
Legumain Inhibits OB Differentiation and Bone Mineralization In Vivo
(A) Conservation of zebrafish lgmn. I, amino acid identity; S, amino acid similarity.
(B) High-resolution melting analysis of pooled lgmn-TALEN and control-injected animals at 3 days post-fertilization (dpf).
(C) qRT-PCR analysis of OB and AD marker genes at 5 dpf. Data represent mean ± SEM of three pools of ten animals. ∗p ≤ 0.05, two-tailed unpaired Student’s t test.
(D and E) Control and lgmn mutant animals at 7 dpf. Scale bars, 500 μM. (D) Bright field and (E) fluorescent alizarin red staining. (E′ and E″) Higher-magnification images of boxed regions. Arrowheads, whole vertebrae stained; arrows, partial vertebrae stained. Scale bars, 100 μM.
(F) Number of alizarin-red-stained vertebrae in lgmn and control animals at 7 dpf. Data represent mean ± SEM, n > 30 for each group. ∗p ≤ 0.05, ∗∗∗p ≤ 0.005 two-tailed unpaired Student’s t test.
(G) Animals were treated with SD-134 (500 μM) or 1% DMSO from 3 to 7 dpf. Number of alizarin-red-stained vertebrae at 7 dpf. Data represent mean ± SEM, n = 12 for each group. ∗∗∗p ≤ 0.005 two-tailed unpaired Student’s t test.