
|
Fig. S6
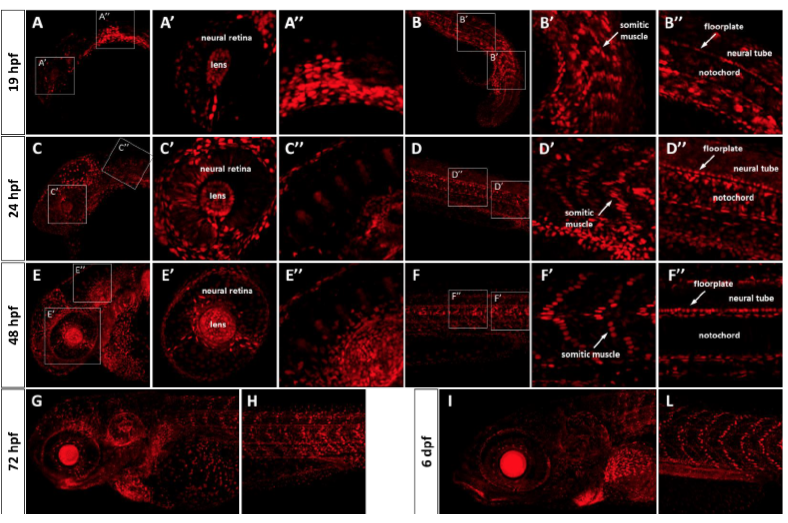
Time series of Yap1/Taz reporter expression during embryonic and early larval stage.
Confocal Z-stack projections of a Tg(Hsa.CTGF:nlsmCherry)ia49 fish at 19 hpf (A-B’’), 24 hpf (C-D’’), 48 hpf (E-F’’), 72 hpf (G-H), and 6 dpf (I-L). (A, C, E, G, I) Full zstack projection of the rostral region of the embryo/larva. (B, D, F, H, L) Full z-stack projection of the trunk of the embryo/larva. Partial z-stack projection limited to the optic cup (A’, C’, E’), the rhombencephalon (A’’, C’’, E’’), the somitic muscles (B’, D’, F’), and the notochord region (B’’, D’’, F’’) are reported in the magnified views. Relevant cell types where the reporter is strongly activated are highlighted at each time point. For the details regarding the reporter protein expression in the different tissues refer to the text and to Figures 3 and 4.