
Image
|
Figure Caption
Fig. S3
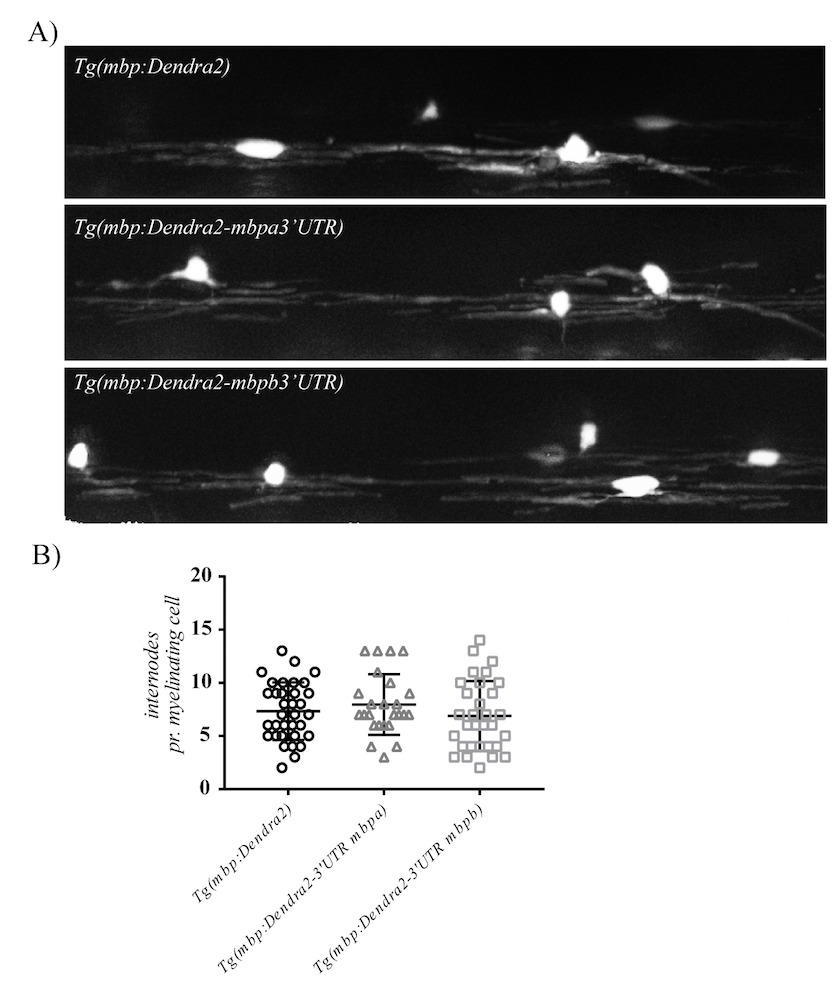
(A) Examples of oligodendrocytes with Dendra2-positive internodes in transgenic larvae. (B) the number of internodes pr. cell was counted in oligodendrocytes with Dendra2-positive internodes. Mean values +/- SD are plotted. Note that no difference in the mean number of internodes generated pr. cell was observed between the different transgenic lines.
Acknowledgments
This image is the copyrighted work of the attributed author or publisher, and
ZFIN has permission only to display this image to its users.
Additional permissions should be obtained from the applicable author or publisher of the image.
Full text @ Front. Mol. Neurosci.