
Image
|
Figure Caption
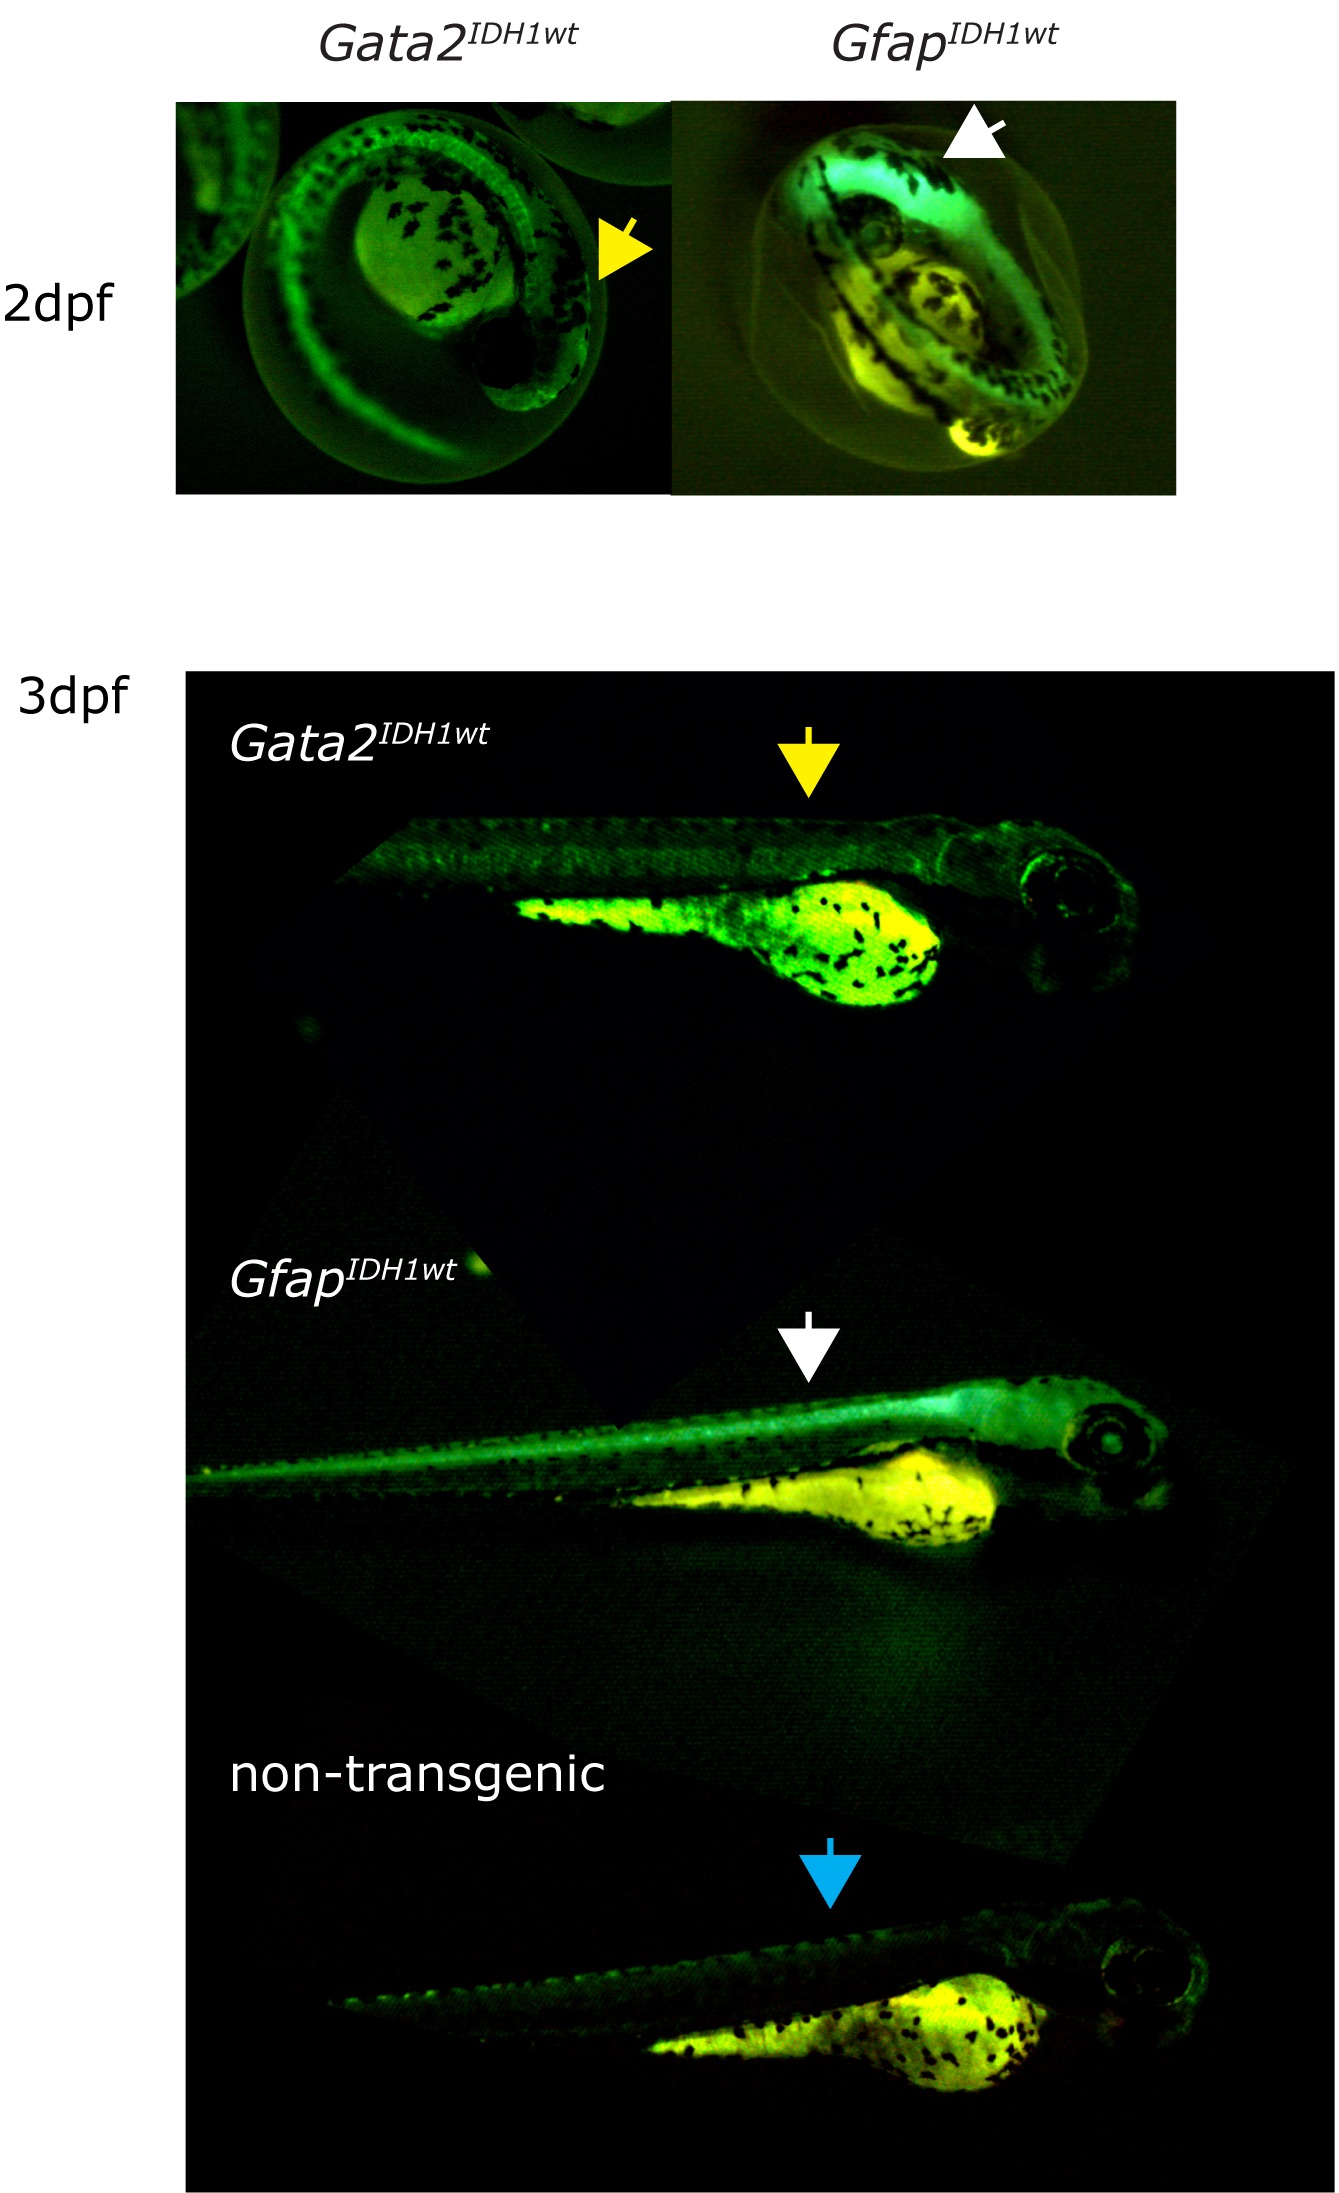
Fig. S7
Gata2GFP transgenic zebrafish shows expression in the notochord of zebrafish.
Yellow arrow: In Gata2IDHwt transgenic fish the transgene is expressed in non-CNS regions (yellow arrow) whereas GfapIDH1wt transgenic fish show CNS-specific expression of transgene (white arrow). The blue arrow shows an absence of GFP signal in non-transgenic fish.
Acknowledgments
This image is the copyrighted work of the attributed author or publisher, and
ZFIN has permission only to display this image to its users.
Additional permissions should be obtained from the applicable author or publisher of the image.
Full text @ PLoS One