
|
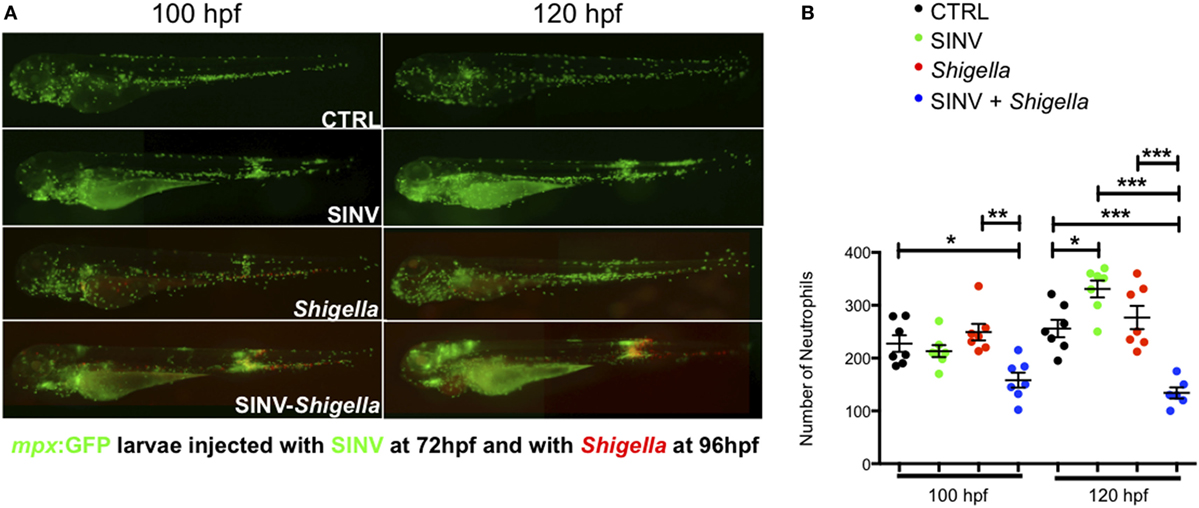
Fig. 3
Impaired neutrophil counts upon Shigella injection in Sindbis virus (SINV) infected fish. (A) mpx:GFP zebrafish larvae (green neutrophils) were sequentially injected intravenously with sublethal doses of SINV-GFP at 72 hpf and the day after with sublethal doses of Shigella-DsRed. As a control, similar doses of SINV-GFP only and Shigella DsRed only were injected in the blood of 72 and 96 hpf mpx:GFP larvae, respectively. The infected larvae were then imaged with a wild field fluorescent microscope over time at 100 hpf (4 h post Shigella injection) and at 120 hpf (24 h post Shigella injection) to monitor the impact of the co-infection on the neutrophil population at the level of the entire organism. Note that it was possible to discriminate under the microscope the GFP label of the SINV-GFP infected cells (diffuse and less bright) from the GFP label of the mpx:GFP neutrophils (brighter). The neutrophil numbers appeared to be decreased in SINV-Shigella co-infected larvae. Overlay of green (SINV and neutrophils) and red (Shigella) fluorescence from single or co-infected fish is shown. (B) Neutrophil counts in uninfected (CTRL, black symbols) or upon sublethal SINV-GFP (green symbols), Shigella-DsRed (red symbols) injection or sequential SINV + Shigella (blue symbol) injection. Neutrophils were counted from images taken on live infected larvae using ImageJ software, and plotted as specified in Section “Materials and Methods.” Mean ± SEM are also shown (horizontal bars). Data plotted are from two pooled independent experiments (n = 7 larvae scored for each condition).