
Image
|
Figure Caption
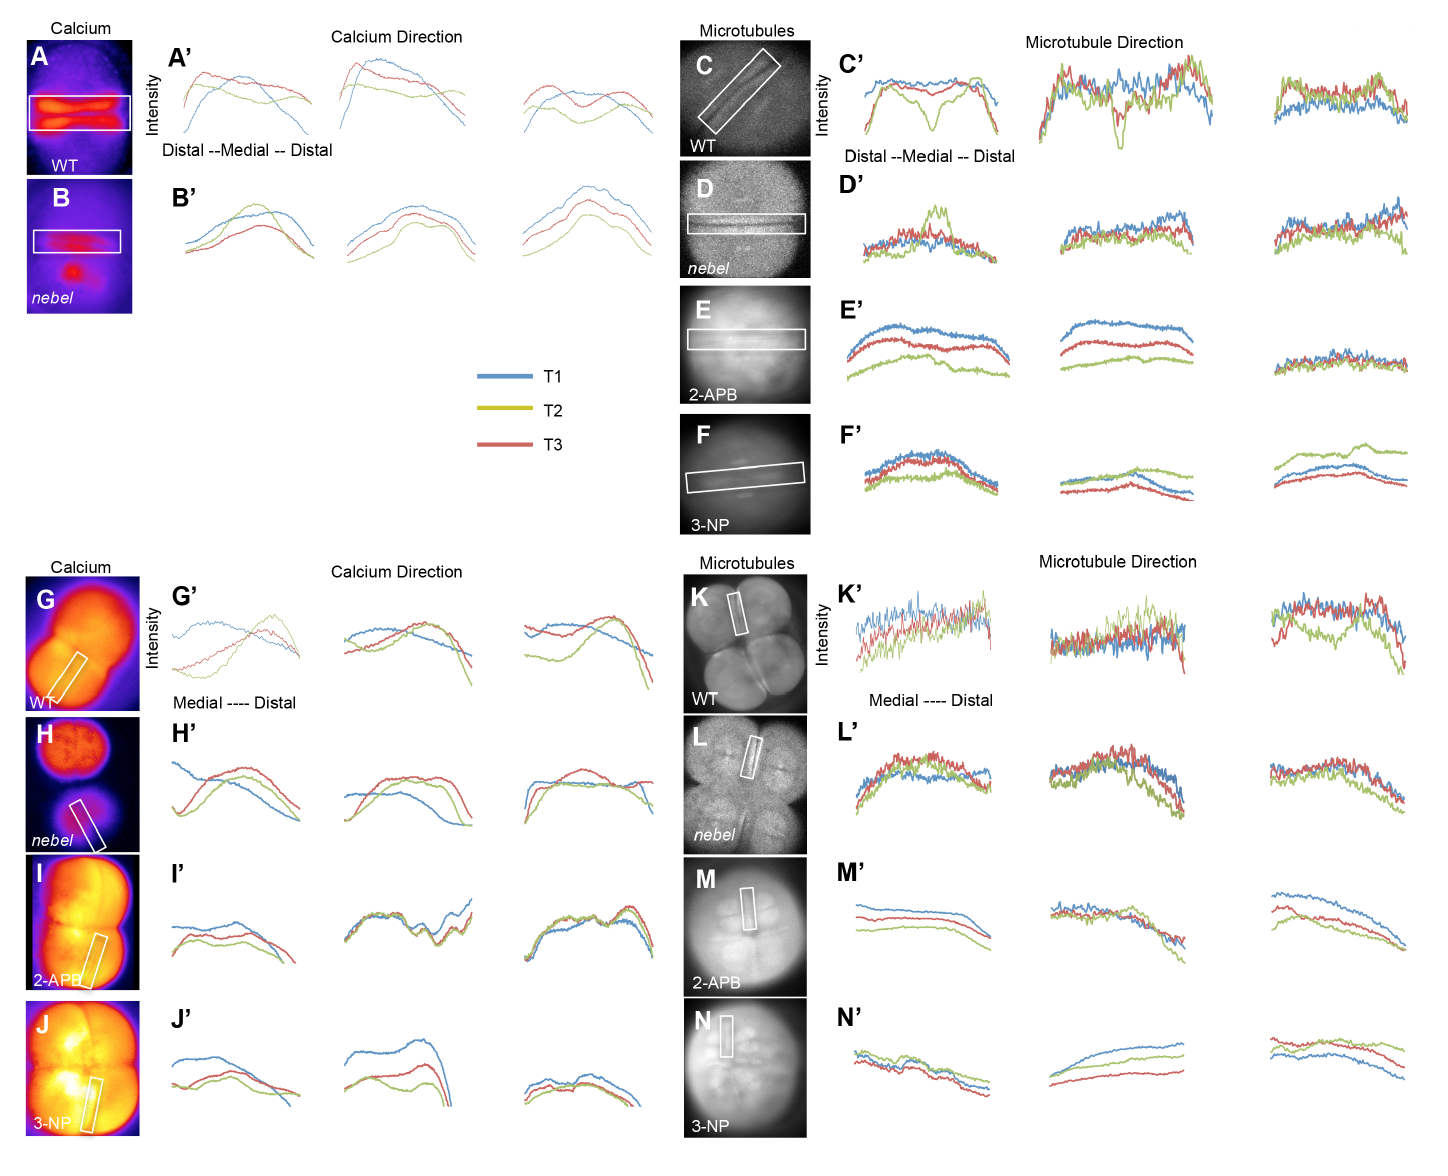
Fig. S3
Correlation of SCWs directionality and FMA movement.
(A-B’,G-J’) Representative intensity profiles of SWCs (using injected OGB/Rhodamine (E-H’) and the FMA (using the EMTB::EGFP transgene (C-F’,K-N’)) in the first and second furrows for three embryos and at three different time points during furrow formation (see Fig. 7 legend) in untreated wild-type (A,C,G,K) and nebel mutant (B,D,H,L) embryos, and 2-APB- (E,I,M) and 3-NP-treated (F,J,N) wild-type embryos. Boxes in the overview image indicate region for intensity scan analysis.
Acknowledgments
This image is the copyrighted work of the attributed author or publisher, and
ZFIN has permission only to display this image to its users.
Additional permissions should be obtained from the applicable author or publisher of the image.
Full text @ Development