Fig. 8
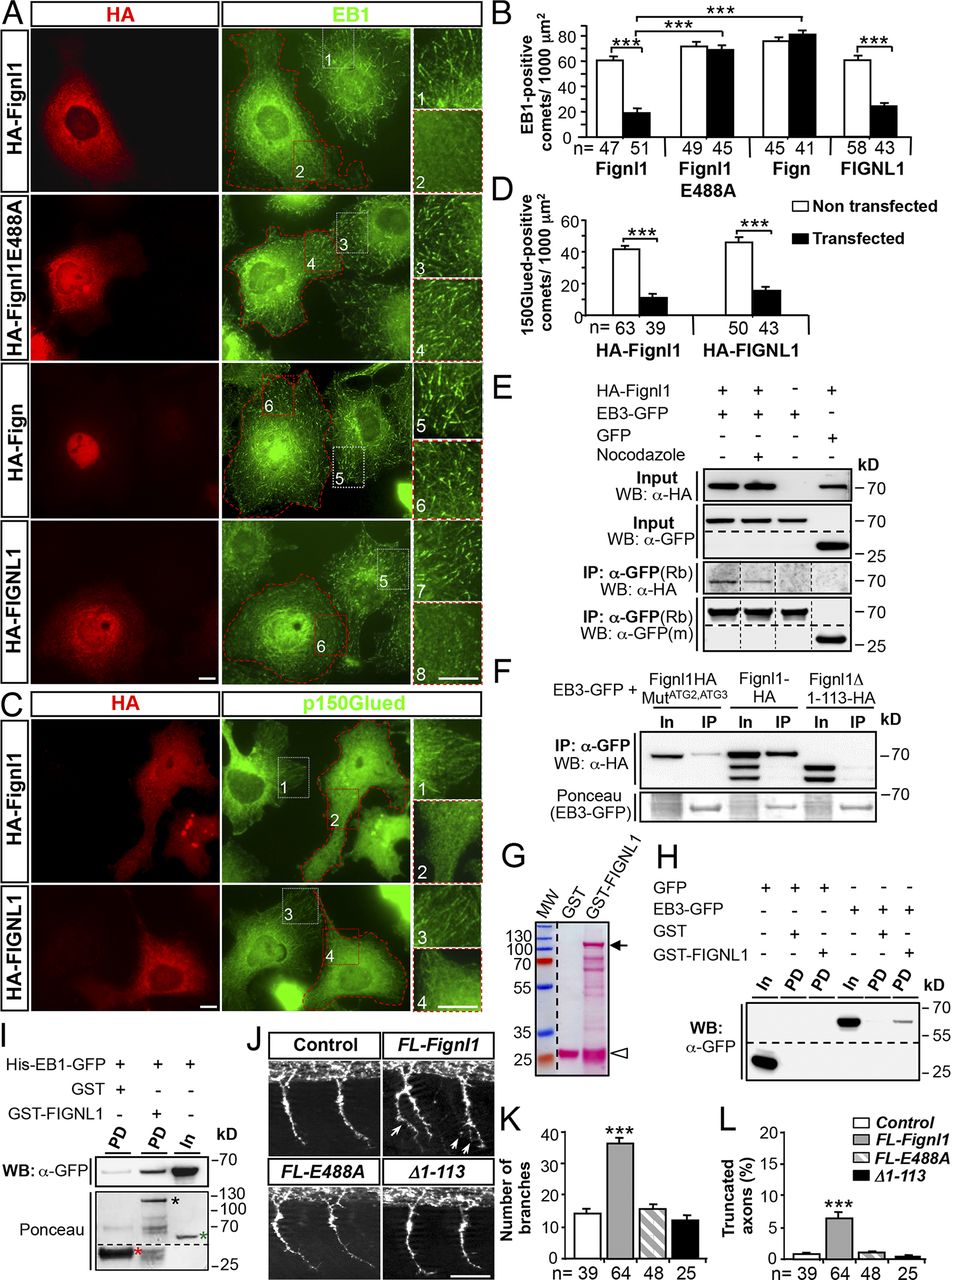
FL-Fignl1 isoform specifically binds EB1/3 and negatively regulates +TIP binding at MT plus ends. (A–D) COS-7 cells overexpressing HA-tagged WT (FL-Fignl1–HA; A–D) and mutated (HA-Fignl1E488A; A and B) zebrafish Fignl1, zebrafish Fign (HA-Fign; A and B), and human Fignl1 (HA-FIGNL1; A–D) were immunolabeled with HA (A and C: red) and EB1 (A: green) or p150Glued (C: green) antibodies. (A and C) Red dashed lines indicate transfected cells. Right panels represent higher magnifications of boxed regions in corresponding panels. (B and D) Mean number of EB1- (B) or p150Glued-positive (D) comets per 1,000 µm2. (E) Co-IP of HA-Fignl1 with EB3-GFP. COS-7 cells were cotransfected with HA-Fignl1 and EB3-GFP or GFP and treated with 20 µM nocodazole or DMSO 24 h posttransfection (hpt). (F) Co-IP of Fignl1 isoforms with EB3-GFP. COS-7 cells were cotransfected with Fignl1-HA, Fignl1MutATG2-ATG3-HA, or Fignl1Δ1–113-HA and EB3-GFP. Ponceau staining shows immunoprecipitated EB3-GFP. (E and F) Co-IP assays were performed 24 hpt with a GFP antibody. (G) Ponceau staining shows the expression of recombinant GST (open arrowhead) and GST-FIGNL1 (arrow) in BL21 E. coli purified on glutathione Sepharose beads. Lower bands result from protein degradation. MW, molecular weight. (H and I) GST pulldown assays. EB3-GFP from COS-7 cells or recombinant His-EB1-GFP (I) were incubated with either GST or GST-FIGNL1–bound beads. (I) Ponceau staining (bottom) shows GST (red asterisk), GST-FIGNL1 (black asterisk), and His-EB1-GFP (green asterisk) recombinant proteins. (E, F, H, and I) Immunoprecipitated or pulled-down proteins were revealed by using HA or GFP antibody. In, input; IP, immunoprecipitation; m, mouse; PD, pulldown; Rb, rabbit. (J) Immunolabeling of pMNs in 26-hpf control and WT Fignl1 (FL-Fignl1), E488A Fignl1 (FL-E488A), or Fignl1Δ1–113 (Δ1–113) mRNA–injected embryos with the use of Znp-1 antibody. Arrows point at aberrant pMN collateral branches. (K) Mean number of branches. (L) Percentage of truncated axons. Quantifications on 12 spinal hemisegments per embryo. The total number (n) of analyzed cells or embryos per condition in three independent experiments is indicated under the histogram bars. ***, P ≤ 0.001; unpaired two-tailed t test (B and D) or Kruskal–Wallis ANOVA test with Dunn’s post hoc test (K and L). Error bars are SEM. Bars: (A and C) 20 µm; (J) 50 µm.

