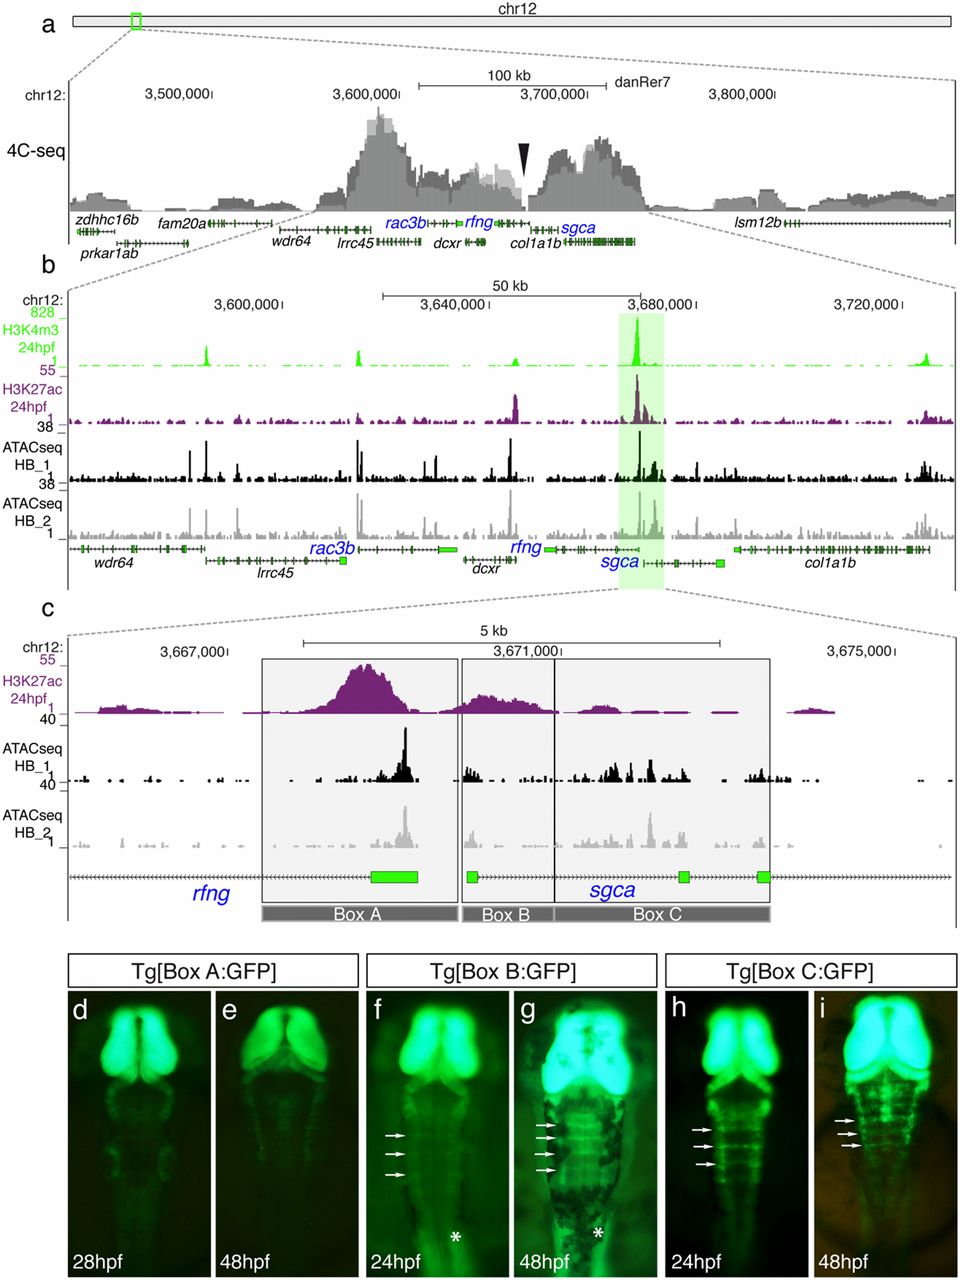
Fig. 4
Identification of hindbrain boundary cell cis-regulatory elements by the analysis of the rac3b/rfng/sgca cluster regulatory landscape. (A) Chromosomal localization of the rac3b/rfng/sgca cluster and chromatin interaction profile by 4C-seq at 24 hpf (n = 2; overlaid gray peaks correspond to both replicates). The viewpoint used for both replicates is showed with a black arrowhead. (B) Enlarged view from A of a 170kb window of chromosome 12 where most of the chromatin interactions, unveiled by 4C-seq, occur. Epigenetic marks of putative promoters (H3K4me3; green peaks) and active enhancers (H3K27ac; magenta peaks) (40) are shown along with ATAC-seq profiles from dissected hindbrains at 24 hpf (n = 2; black and gray profiles). (C) Magnification of the region framed in B showing the H3K27ac profile and hindbrain-specific ATAC-seq signatures. The ∼5.6kb region (gray-shaded region) was divided in three fragments associated with hindbrain ATAC-seq peaks (Boxes A–C), which were cloned in an enhancer reporter vector to generate stable transgenic lines. (D–I) Dorsal views of embryonic hindbrains from Tg[Box A:GFP] (D and E), Tg[Box B:GFP] (F and G), and Tg[Box C:GFP] (H and I) stable transgenic lines at indicated stages. Note that Box B and Box C sequences (but not Box A) are able to drive GFP expression to the hindbrain boundaries (white arrows in F–I). White asterisks in F and G show the expression of GFP in the somites. In all images, the anterior is at the top.

