
|
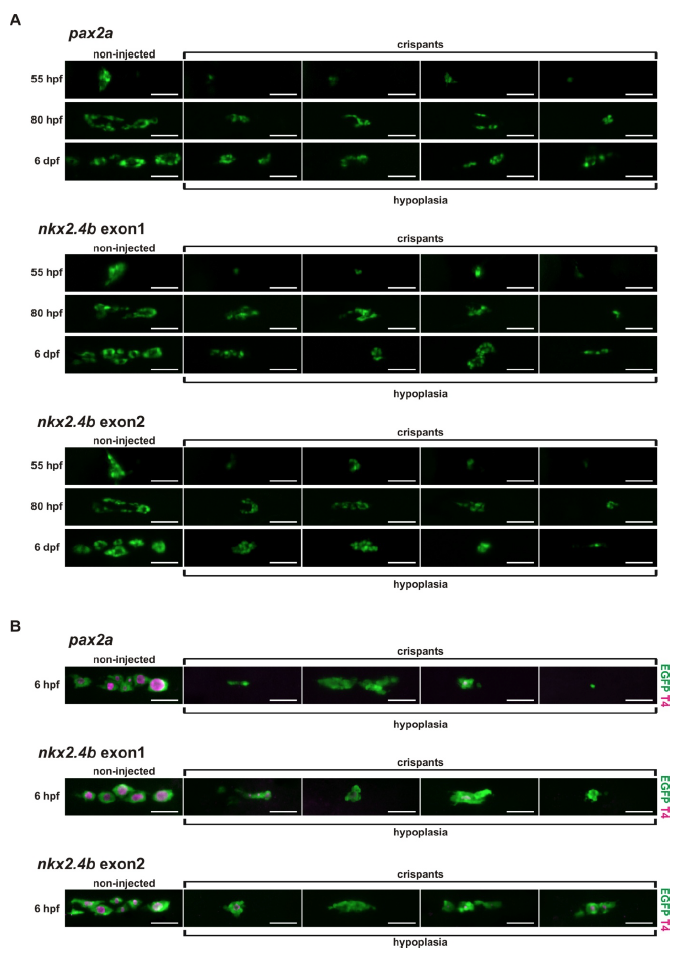
Fig. S2
Phenotypic spectrum of pax2a and nkx2.4b crispants. (A) Epifluorescence live imaging of Tg(tg:nlsEGFP) zebrafish larvae injected with Cas9 protein and sgRNAs targeting pax2a or nkx2.4b (exon 1 and exon 2), respectively. Ventral views of the thyroid region (anterior to the right) are shown for non-injected control fish and four different crispants displaying hypoplasia of variable severity. Images were aquired at 55 hpf, 80 hpf, and 6 dpf. (B) Whole-mount immunofluorescence staining of Tg(tg:nlsEGFP) zebrafish for EGFP and colloidal T4 at 6 dpf. Ventral views of the thyroid region (anterior to the right) are shown for non-injected control fish and four different crispants displaying hypoplasia of variable severity. Scale bars: 50 μM.