
|
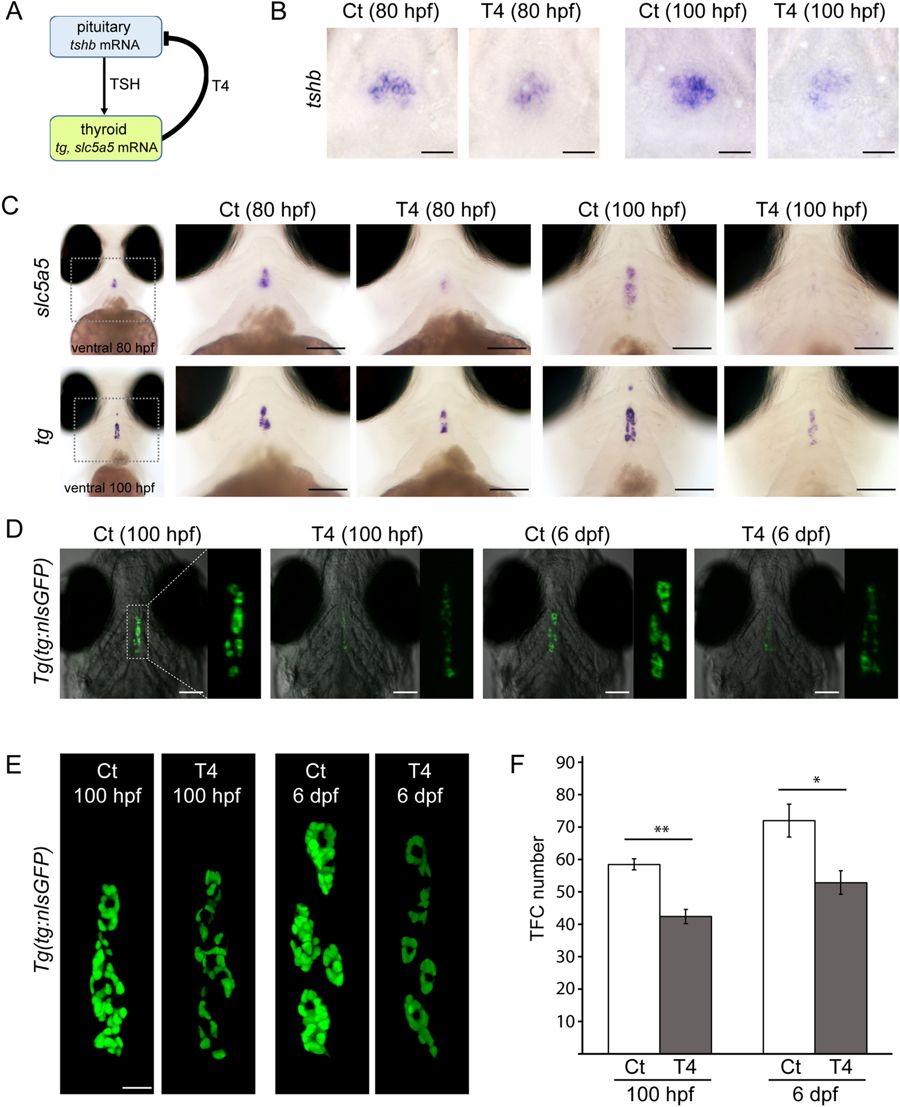
Fig. 2
Live imaging of transgenic Tg(tg:nlsEGFP) fish reveals diminished reporter expression and thyroid hypoplasia in thyroxine-treated fish. (A) Model for thyroid hormone negative feedback loop along pituitary-thyroid axis with tissue-specific gene expression markers examined in this study. T4, thyroxine; TSH, thyroid-stimulating hormone. (B,C) Treatment of zebrafish embryos with 5.0 µg/L T4 affects pituitary and thyroid gene expression as demonstrated by WISH. Pituitary expression of tshb mRNA (see ventral views in B) is reduced in T4-treated fish compared to untreated controls (Ct). At the thyroid level, expression of the TSH-dependent gene slc5a5 is strongly decreased following T4 treatment (ventral views in C, upper panels). T4-treated fish also showed decreased tg mRNA expression and a reduced number of tg mRNA expressing cells (ventral views in C, lower panels), effects which were more marked at 100 hpf. (D) Epifluorescence microscopy of live Tg(tg:nlsEGFP) fish revealed a strongly reduced intensity of the fluorescent reporter signal in T4-treated fish relative to untreated controls (Ct). For each embryo shown (ventral view), three-fold magnified views of the thyroid region are displayed (GFP channel). (E) Comparative analysis of thyroid morphology in control (Ct) and T4-treated larvae by confocal live imaging of g(tg:nlsEGFP) fish. 3D reconstructions of confocal images (ventral views) are shown. At 6 dpf, thyroids of T4-treated fish appeared atrophic (smaller follicles and reduced reporter expression). (F) Quantification of thyroid follicular cell (TFC) number in untreated controls (Ct) and T4-treated fish. Results are shown as means ± S.E.M (N = X − Y). Asterisks denote significant differences between treatment means at the indicated developmental stages (*P < 0.05, **P < 0.01, Student’s t-test). Anterior is to the top in all images. Scale bars: 20 µm (B,E) and 100 µm (C,D).