
|
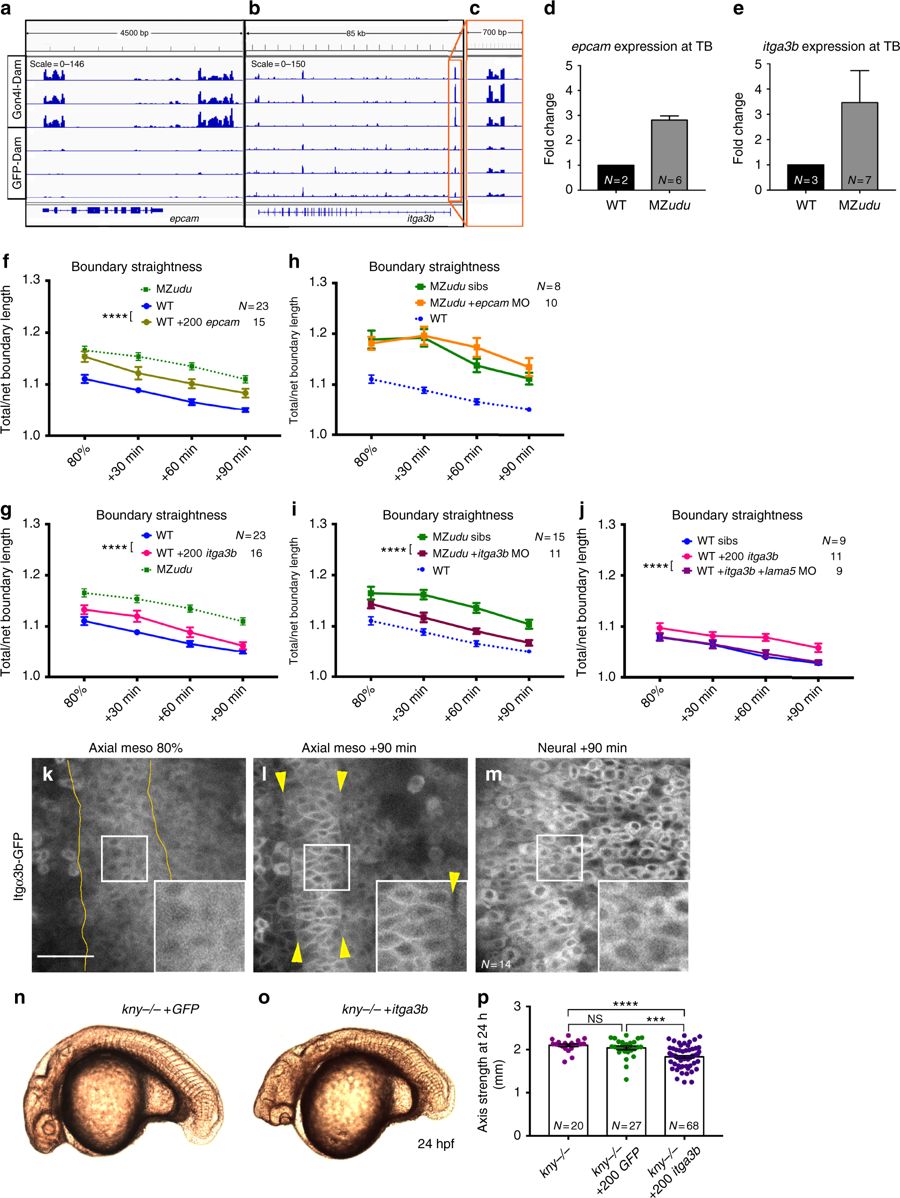
Fig. 7
Gon4l regulates notochord boundary straightness by limiting itga3b expression. a–c Genome browser tracks of Gon4l-Dam and GFP-Dam association at the epcam (a) and itga3b (b) locus. An expanded view of the itga3b promoter is shown in c. d–e Quantitative RT-PCR for epcam (d) and itga3b (e) in WT and MZudu−/− embryos at tailbud stage. N indicates the number of independent clutches tested with technical triplicates of each, bars are means with SEM. f–g Quantification of notochord boundary straightness in WT epcam (f) or itga3b (g) overexpressing embryos (two-way ANOVA, ****p < 0.0001). h–i Notochord boundary straightness in MZudu−/− epcam (h) or itga3b (i) morphants and sibling controls (two-way ANOVA, ****p < 0.0001). j Quantification of notochord boundary straightness in WT itga3b-overexpressing embryos with or without lama5 MO (two-way ANOVA, ****p < 0.0001). N indicates the number of embryos analyzed, symbols are means with SEM. k–m Itgα3b-GFP localization in WT embryos in the tissues and at the time points indicated. Insets are enlarged from regions in white squares. Yellow lines and arrowheads mark notochord boundaries. Images are representative of three independent trials. Scale bar is 50 μm. n–o Live images of kny−/− embryos at 24 hpf injected with 200 pg GFP (n) or 200 pg itga3b (o) RNA. Images are representative of four independent experiments. p Quantification of axis length of injected kny−/− embryos at 24 hpf. Each dot represents one embryo, bars are means with SEM (T-tests, ***p < 0.001, ****p < 0.0001). N indicates number of embryos analyzed