Fig. 5
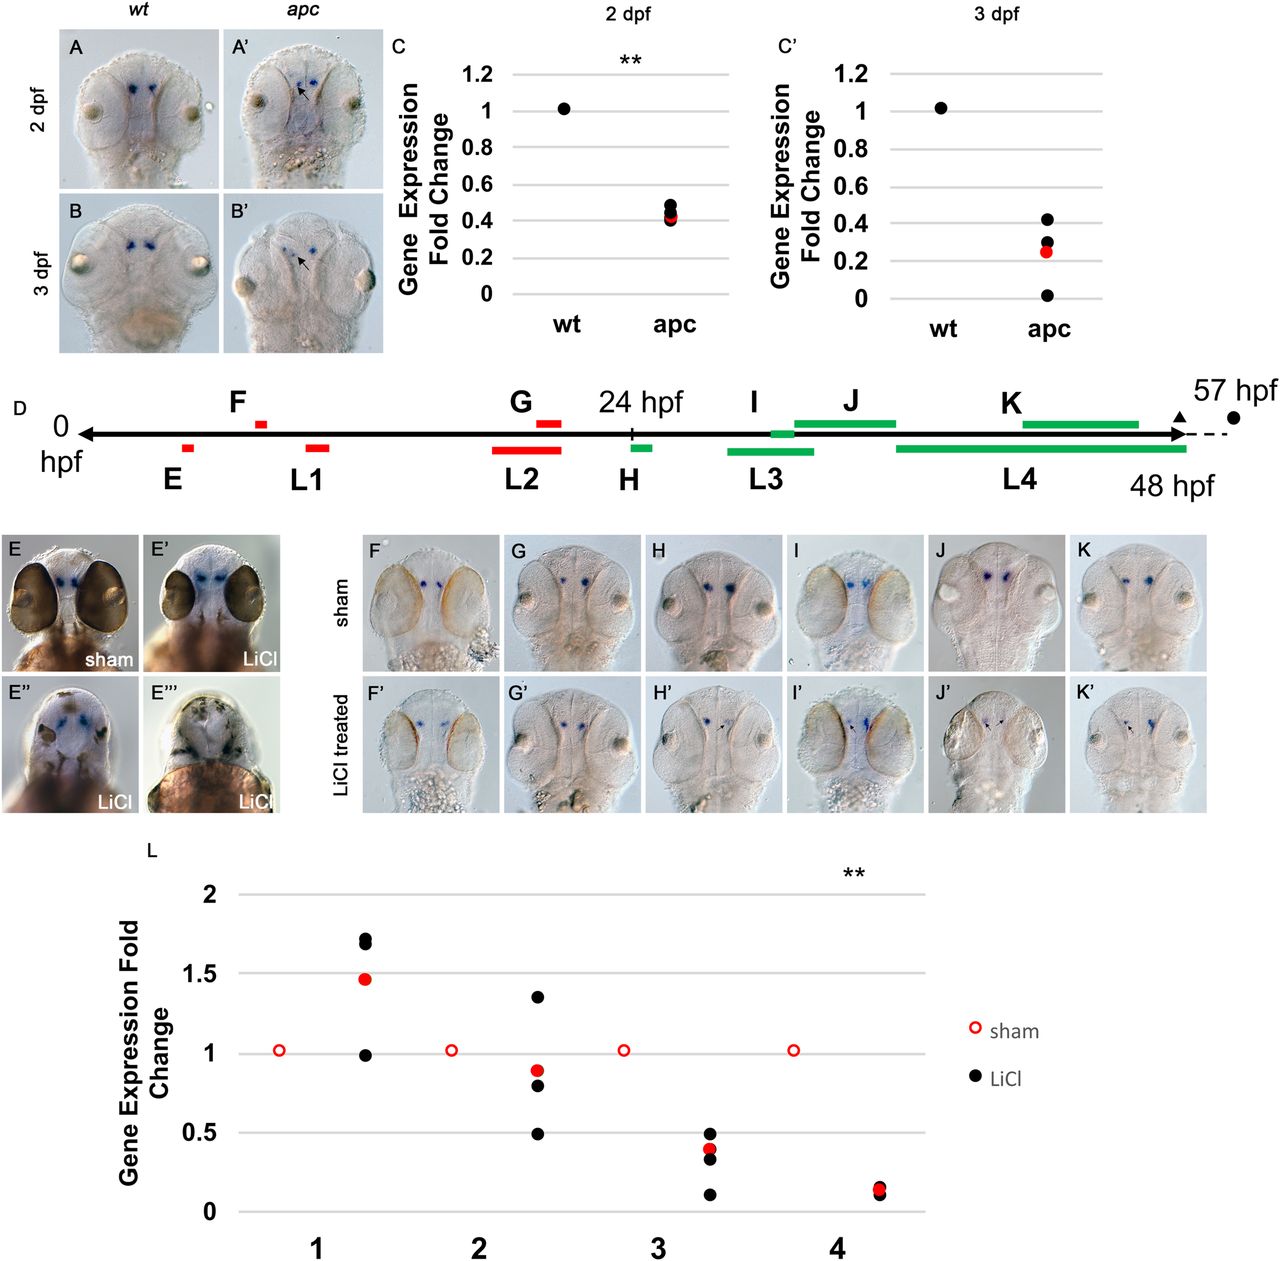
Expression of oxt is reduced in the apc mutant and LiCl-treated embryos starting at 24 hpf. A-B′ are all dorsal views of WISH for oxt magnified ×100. (A,A′) 48 hpf embryos. (B,B′) 72 hpf embryos. (A,B) wild-type siblings. (A′,B′) apc mutants in which arrows indicate areas of reduced oxt expression. (C,C′) oxt expression was measured at 48 and 72 hpf in wild-type and apc mutant embryos using RT-qPCR. Gene expression values were normalized to an endogenous control, beta actin 2 (actb2), and are expressed as fold changes relative to wild-type sibling controls. **P<0.01, two-tailed paired Student's t-test. Dot plots show three biological replicates (black) and the mean (red). (D) Timeline schematic showing LiCl treatment time and duration. Lettering in the schematic corresponds to labeling in the figure. Triangle represents fixation point for treatments E,F,G,H,I,K and L. Circle represents fixation point for treatment J. Red, no effect on oxt expression. Green, leads to reduced oxt expression. E,E′,E″,E′″ are all dorsal views of WISH for oxt magnified ×100. E-K′ are all dorsal views of WISH for oxt in wild-type embryos magnified ×100. E,F,G,H,I,J,K underwent sham treatment in fish water. E′,E″,E″′,F′,G′,H′,I′,J′,K′ were treated with LiCl. Arrows in F′,G′,H′,I′,J′,K′ indicate areas of reduced oxt expression. (E-K′) 48 hpf. (J,J′) 57 hpf. (E-E′″) treated at 5 hpf for 20 min. (F,F′) treated at 8 hpf for 30 min. (G,G′) treated at 20 hpf for 1 h. (H,H′) treated at 24 hpf for 1 h. (I,I′) treated at 30 hpf for 1 h. (J,J′) treated at 31 hpf for 4.5 h. (K,K′) treated at 41 hpf for 5 h (L) oxt expression was measured in LiCl and sham treated embryos at 48 hpf using RT-qPCR. 1: treated at 10 hpf for 1 h; 2: treated at 18 hpf for 3 h; 3: treated at 28 hpf for 3.75 h. 4: treated at 36 hpf for 12 h. Gene expression values were normalized to an endogenous control, beta actin 2 (actb2), and are expressed as fold changes relative to sham-treated wild-type sibling controls. **P<0.01, two-tailed paired Student's t-test. Dot plot shows three biological replicates (black) and the mean (red).

