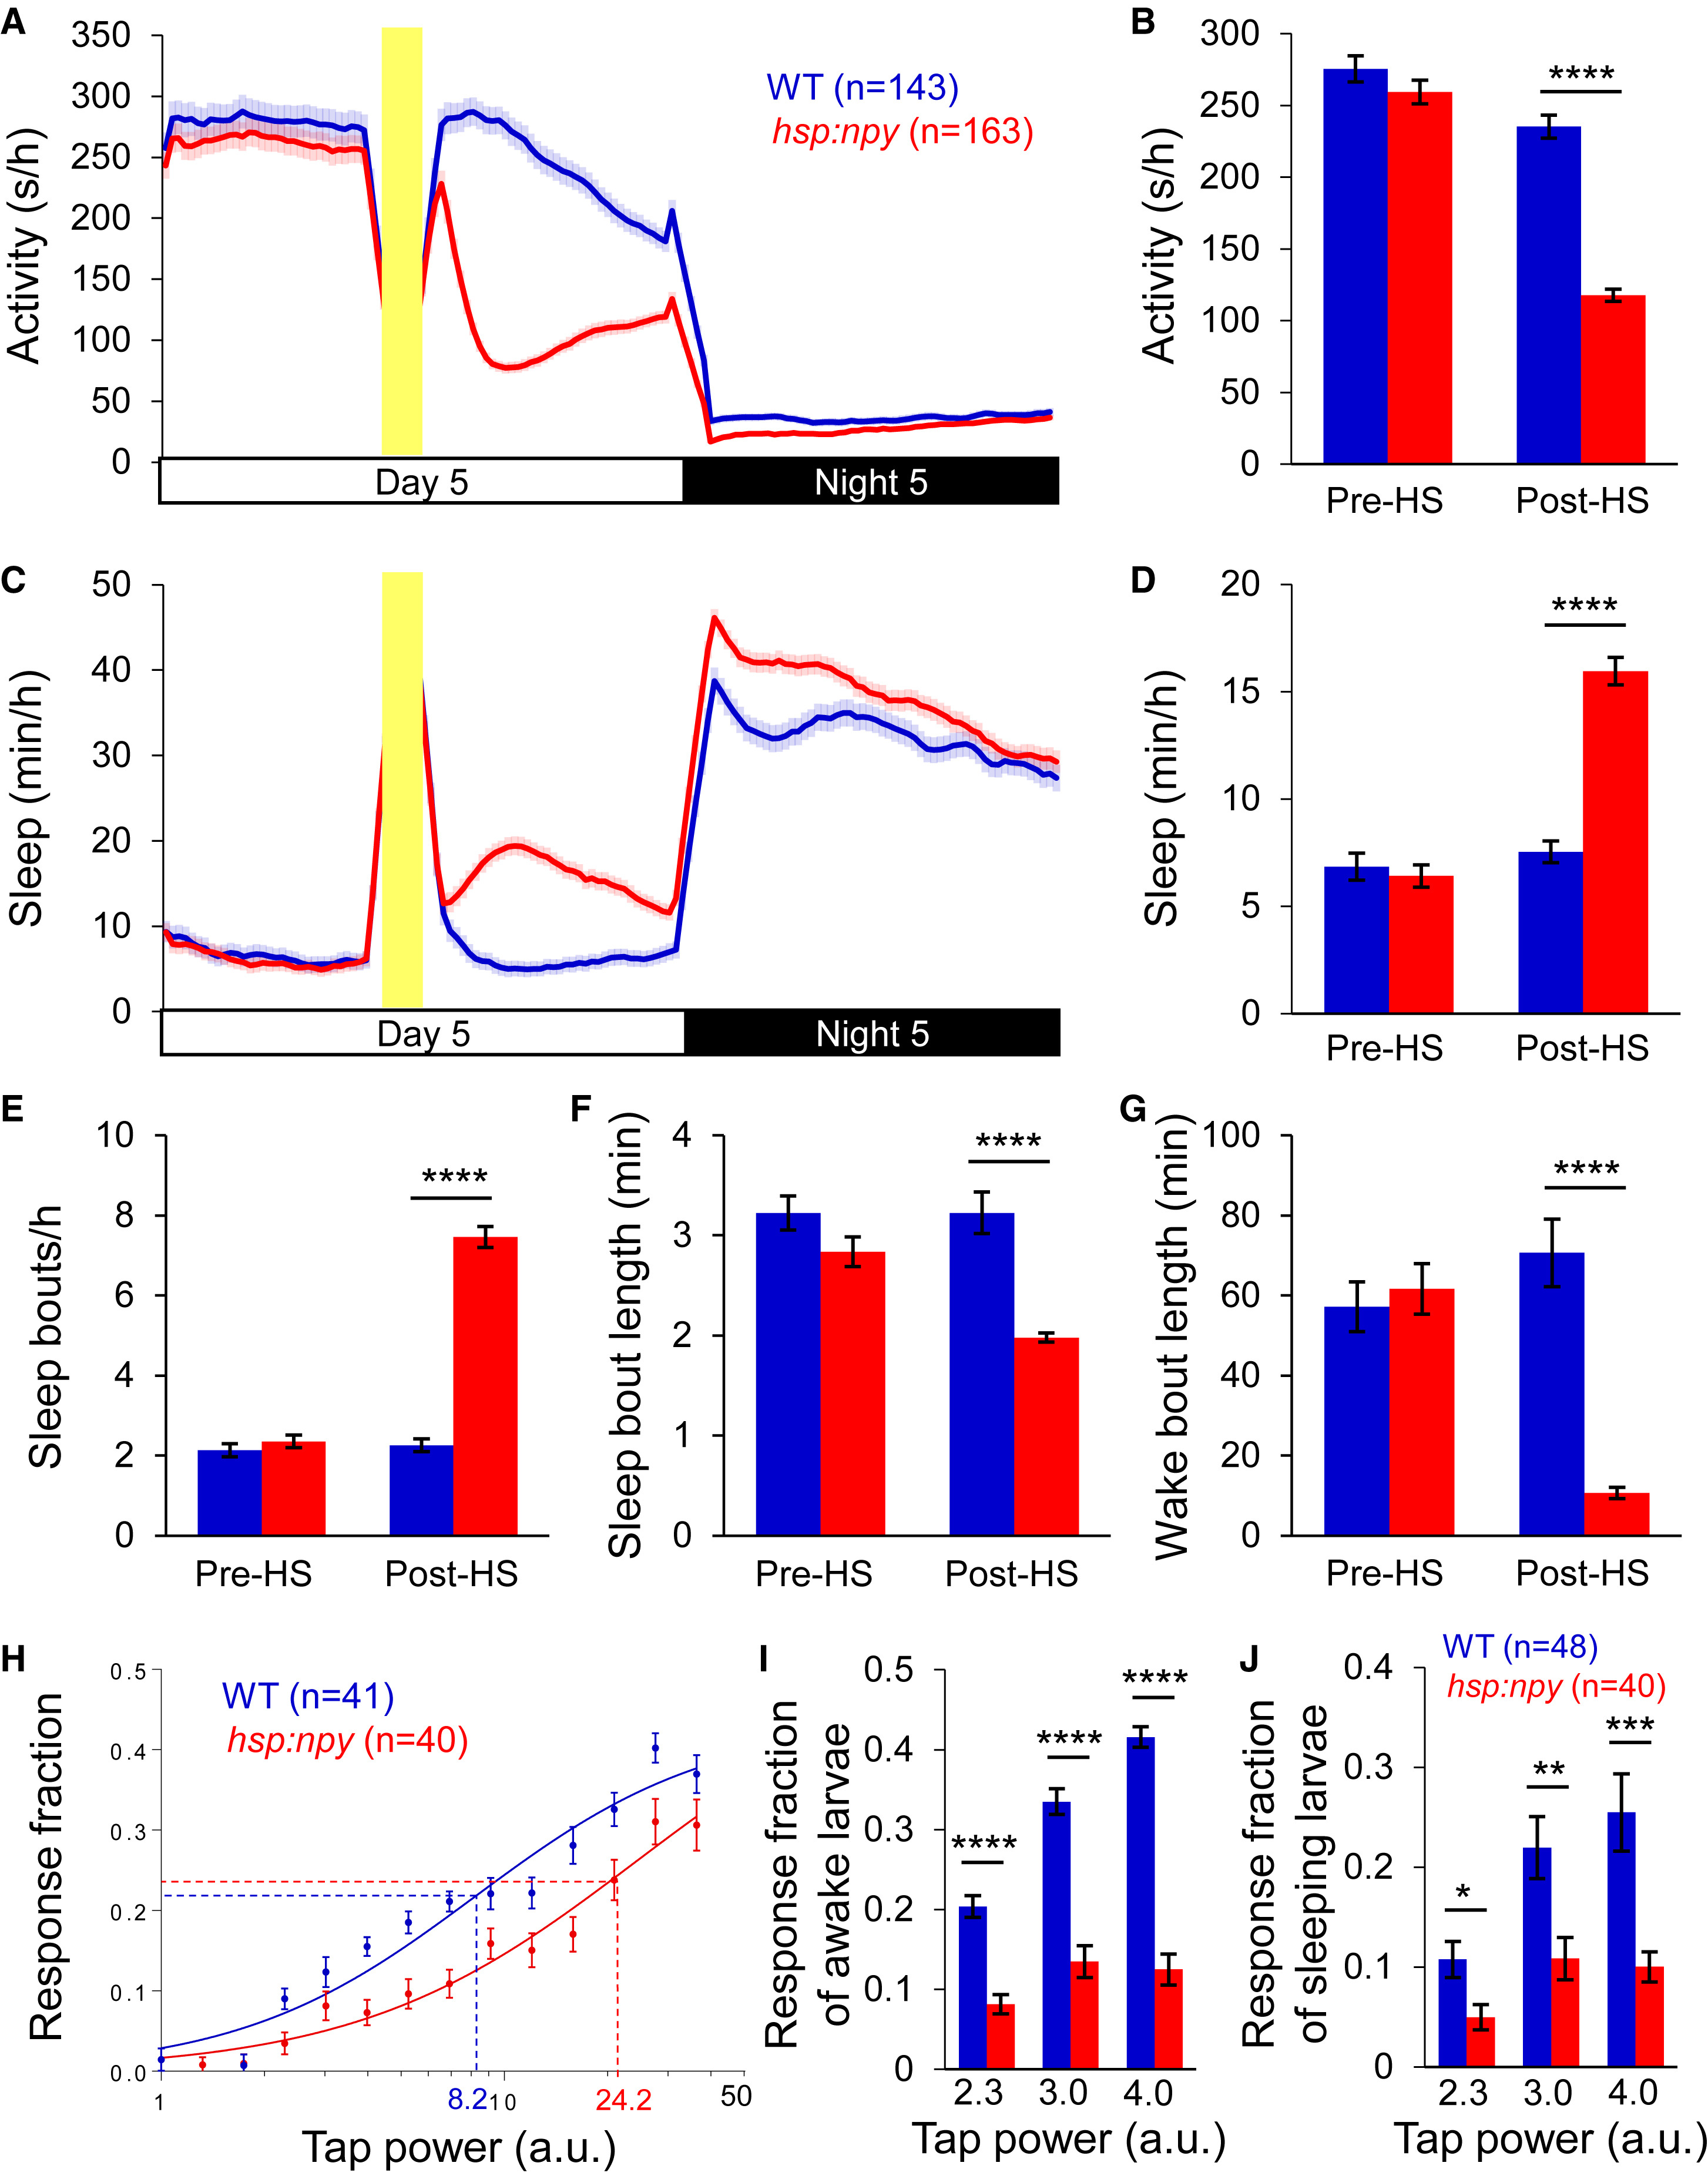
Fig. 1 Overexpression of Zebrafish NPY Increases Sleep and Arousal Threshold (A–G) Overexpression of zebrafish NPY following a heat shock at 3 p.m. resulted in decreased locomotor activity (A and B) and increased sleep (C and D), due to more sleep bouts (E) and shorter sleep (F) and wake (G) bouts. Yellow bars indicate heat shock (HS). Pre-HS and post-HS quantify data for day 5 before and after HS. Mean ± SEM from four experiments is shown. (H) Representative stimulus-response curve for Tg(hsp:npy) animals compared to WT siblings following HS. Data points represent mean ± SEM. Dashed lines mark ETP50 value for each genotype. Tg(hsp:npy) animals had an ETP50 value of 24.2 versus 8.2 for WT siblings (293% increase, p < 0.05 by extra sum-of-squares F test). (I and J) Overexpression of NPY reduced the response of Tg(hsp:npy) animals to the stimulus compared to WT siblings during both awake (I) and sleep (J) states. Stimulus intensities of 2.3, 3.0, and 4.0 arbitrary units (a.u.) were tested. A dose-dependent response was observed for WT animals, but not their Tg(hsp:npy) siblings. Bar graphs show mean ± SEM. n, number of animals. ∗p < 0.05; ∗∗p < 0.01; ∗∗∗p < 0.001; ∗∗∗∗p < 0.0001 by two-tailed Student’s t test. See also Figures S1 and S2 and Movie S1.
Image
Figure Caption
Figure Data
Acknowledgments
This image is the copyrighted work of the attributed author or publisher, and
ZFIN has permission only to display this image to its users.
Additional permissions should be obtained from the applicable author or publisher of the image.
Full text @ Curr. Biol.

