Fig. 1
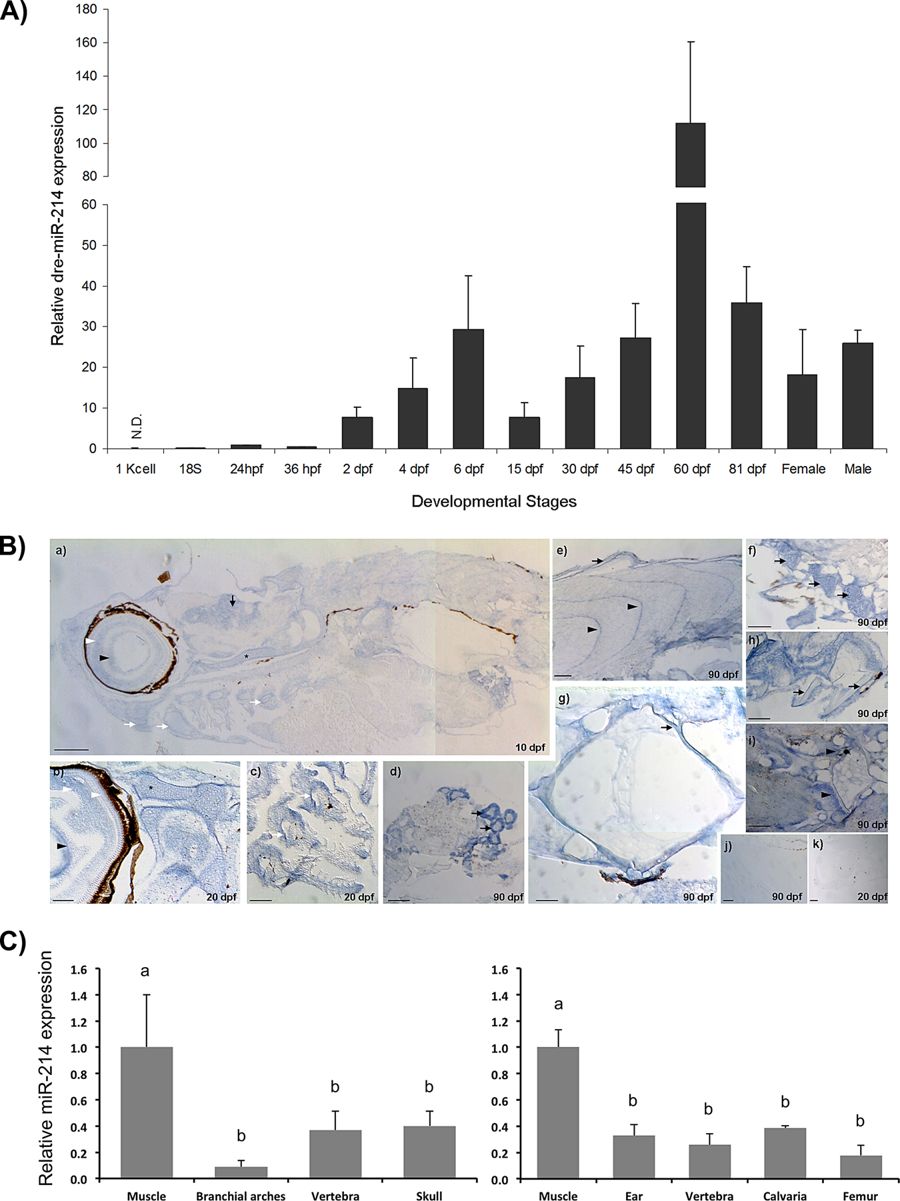
miR-214 expression correlates with skeletal elements in zebrafish. (A) Expression of miR-214 during zebrafish development, determined by miRNA qPCR. Values were normalized using zebrafish U6 small RNA and 24 hpf as reference sample and represent the mean ± s.d. of at least 3 independent replicates. hpf hours post fertilization, dpf days post fertilization, N.D. non-detected. Gap in the y-axis separates two different scales. (B) Detection of miR-214 by in situ hybridization in zebrafish with 10 (a), 20 (b, c, d) and 90 (e, f, g, h, i) dpf. From head to tail, miR-214 was detected in eye lens (arrowhead, a, b), retina (white arrowheads, a, b), brain (arrow, a), chondrocranium (asterisk, a, b), pharyngeal cartilage (white arrows, a, c), kidney (arrows, d), scales (arrow, e), muscle myotomes (arrowheads, e), cartilage in the base of pectoral fins (arrows, f), notochordal sheath (arrow, g), osteoid of haemal arches (arrows, h) and growth zones of vertebral body (arrowheads, i). Hybridization with negative control (scrambled) probe did not produce detectable signal, as observed in 90 and 20 dpf specimens (j and k, respectively). Scale bars: 0.2 mm for a, e, f and k; 0.1 mm for b, c, d, h, i and j; and 0.05 mm for g. (C) Relative expression of miR-214 in zebrafish (left panel) and mouse (right panel) adult tissues, determined by miRNA qPCR. Values were normalized using U6 small RNA and muscle as reference sample and represent the mean ± s.d. of at least 3 independent replicates (one-way Anova, different letters indicate statistical significance, p < 0.05). B. arches, Branchial arches. dpf days post fertilization.

