Fig. 1
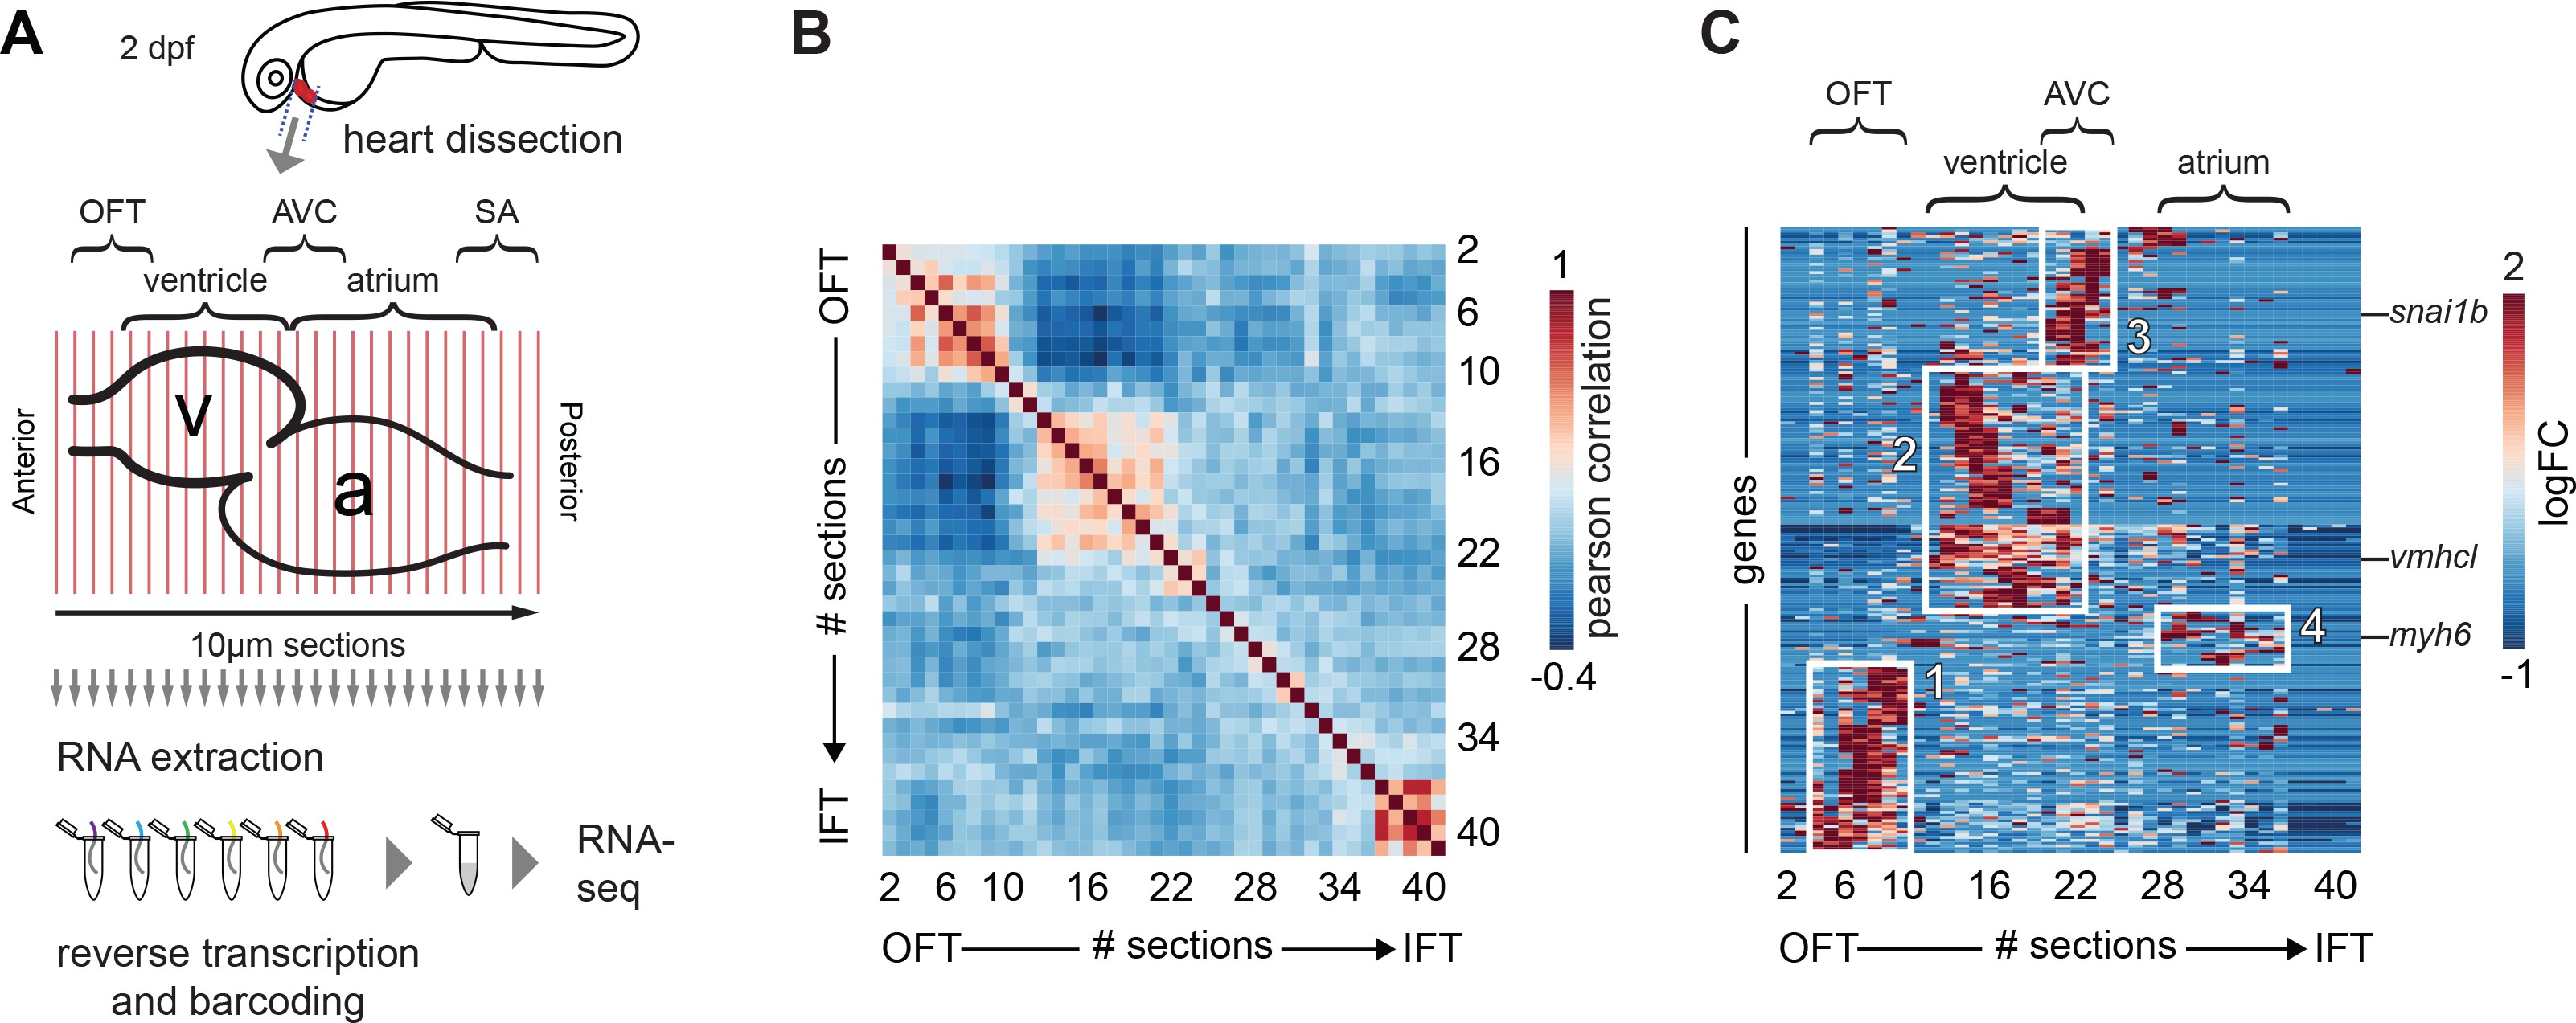
Tomo-seq on isolated embryonic hearts reveals distinct clusters of gene expression.
(A) Hearts were isolated from 2-day-old embryos and 10 μm sections were made along the anterior-posterior axis, from outflow to inflow pole. Each section was collected in an individual tube followed by RNA isolation and cDNA transcription using section specific barcodes. After that, samples were pooled for linear amplification and sequence library preparation. (B) Pairwise correlation between individual sections across all genes detected at more than 20 reads in at least two sections. + 1 equals total positive correlation, 0 no correlation, −1 total negative correlation. Blocks of correlating sections can be observed. (C) Hierarchical cluster analysis of gene expression per section. Distinct gene expression clusters correspond to different regions of the heart shown in boxed areas: 1. arterial pole/OFT; 2. Ventricle; 3. AV canal; 4. Atrium. RNA sequencing reads per gene were normalized against the total read count per section as well as the total spike-in control RNA read counts. Genes expressed in min three sections z-value >1.25. See also Figure 1—figure supplement 1 and Figure 1—source data 1.

