
|
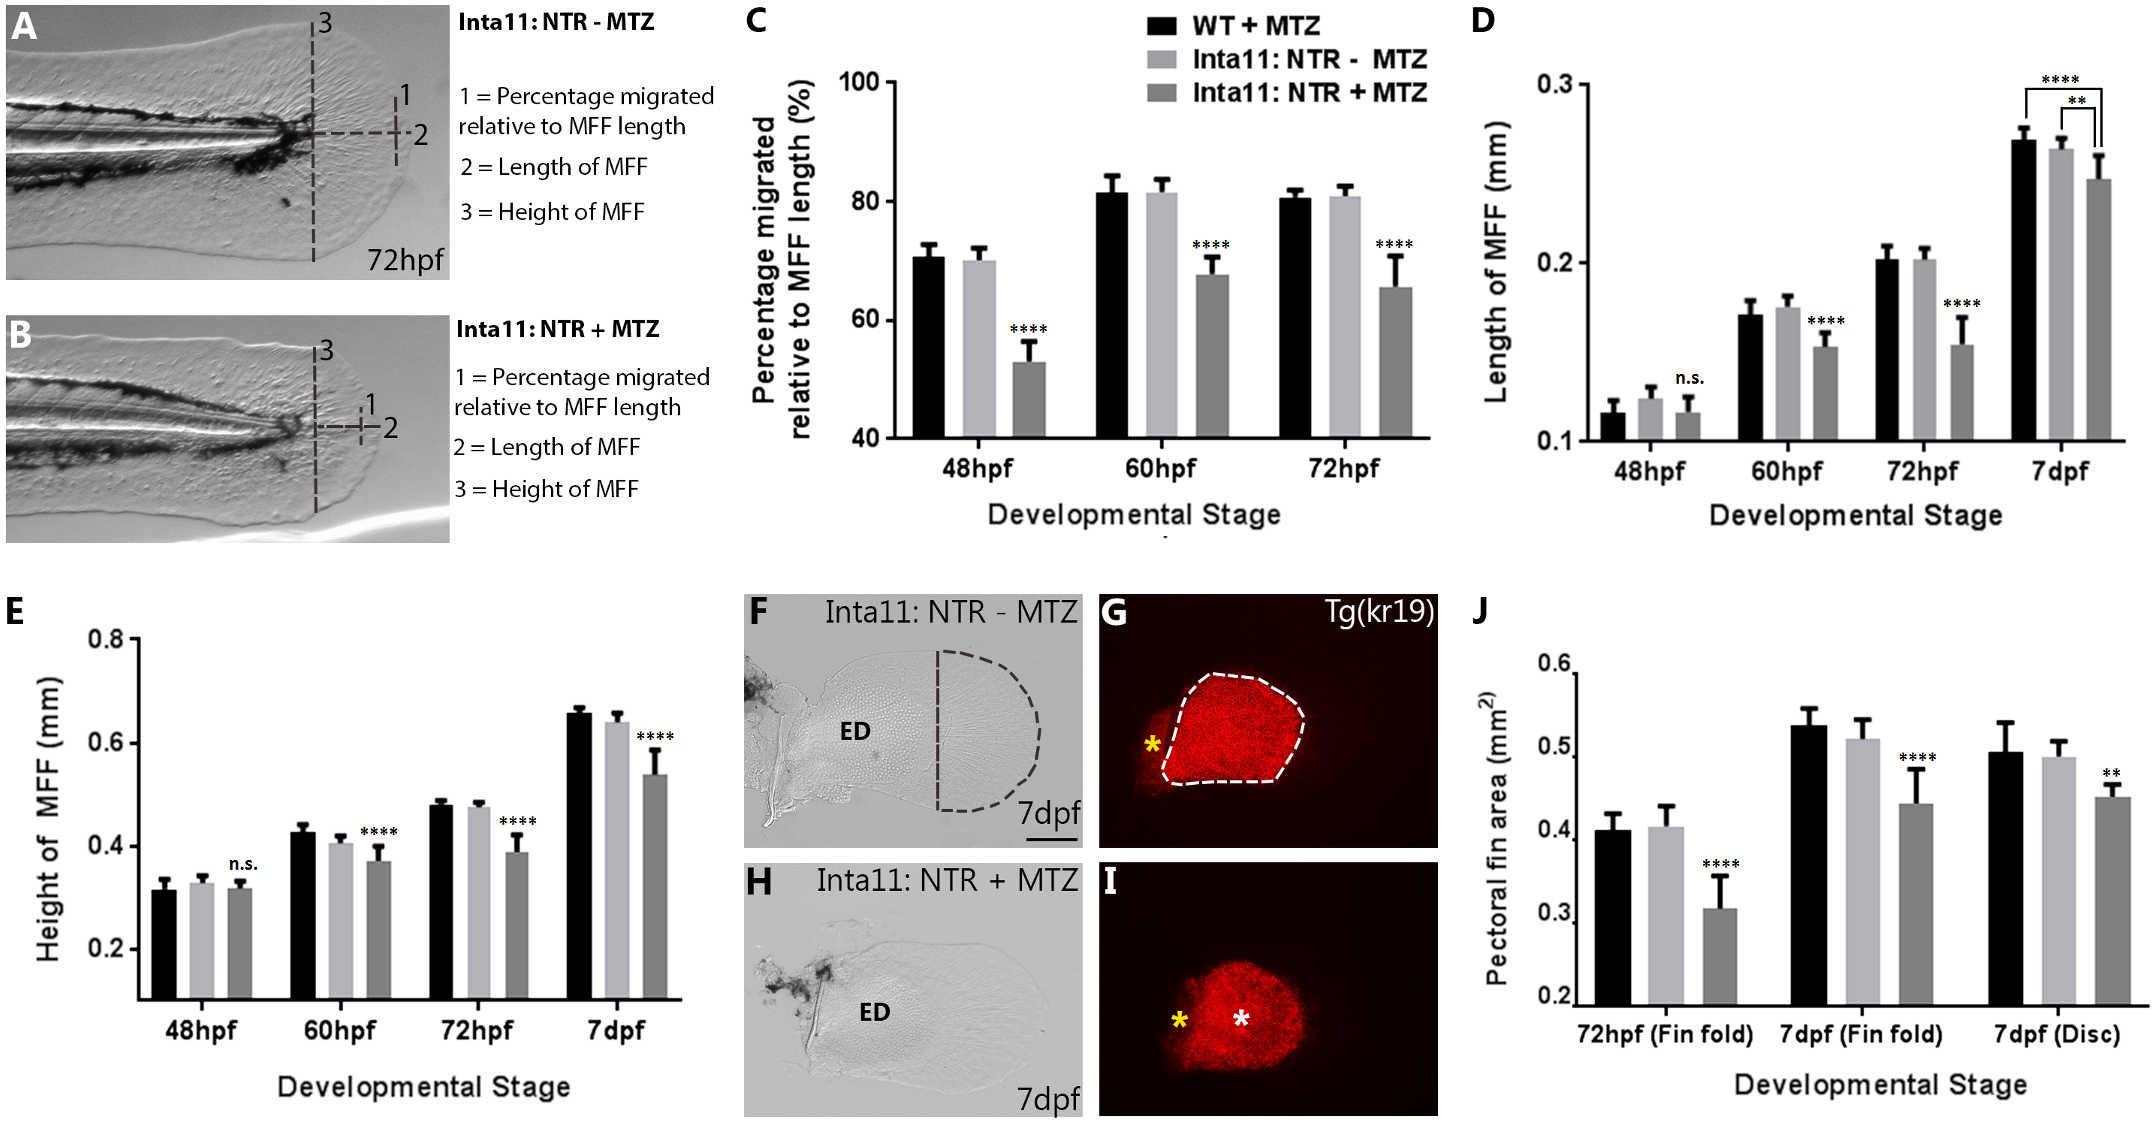
Fig. 6
Metronidazole-treated Tg(Inta11:NTR) larvae show defects in median fin fold mesenchyme migration, a reduction in median and pectoral fin fold size and a reduction in endoskeletal disc size.
(A-B) Schematic of median fin fold measurements. (C-E, J) Graphs displaying measurements of median fin mesenchyme displacement (%), median fin fold width (mm) and height (mm), and pectoral fin fold and endoskeletal disc area (mm2). (F-G) Inta11: NTR—MTZ and (H-I) Inta11: NTR + MTZ pectoral fin at 7dpf outcrossed with Tg(kr19) to highlight endoskeletal disc. Fin fold mesenchyme cell displacement is represented as a percentage displaced relative to the overall fin fold length (trunk to distal tip) (Measurement 1), length of median fin fold is measured from trunk to distal tip (measurement 2), and height of median fin fold is measured from dorsal to ventral tips at the trunk (measurement 3) (A-B). Inta11: NTR + MTZ larvae display a reduction in median fin fold mesenchyme cell displacement at 48, 60, and 72hpf compared to control larvae (C). Inta11: NTR + MTZ larvae show a reduction in median fin fold width and height at 60, 72hpf, and 7dpf compared to control larvae (D, E). No difference is observed for either measurement at 48hpf (D, E). Inta11: NTR + MTZ larvae show a decrease in pectoral fin fold area at 72hpf, and 7dpf, as well as a reduction in endoskeletal disc size at 7dpf (J). Example of Inta11: NTR—MTZ (F, G) and Inta11: NTR + MTZ (H, I) pectoral fin used for distal fin fold, endoskeletal disc measurements. Region used for measurement is indicated by dotted line (F, G). Note the decreased disc size in the Inta11: NTR + MTZ pectoral fin (white asterisks) (I). Scapulocoracoid not included in the disc area measurements (yellow asterisks) (G, I). All bar values are an average of 10 measurements (n = 10 fins) with standard deviation indicated, with the exception of endoskeletal disc size (J). Endoskeletal disc values are based on measurements of 5, 5, and 8 fins (n = 5 fins, n = 5 fins, n = 8 fins) for treatment controls and Inta11: NTR + MTZ larvae respectively. Standard one-way ANOVA was performed. Each mean was compared against both other means. Tukey’s correction was applied. No statistically relevant difference was ever detected between treatment controls (WT + MTZ, Inta11: NTR—MTZ). Inta11: NTR + MTZ P-values (asterisks) are representative of comparisons with both treatment controls, with the exception of median fin fold width at 7dpf, where unique P-values are indicated for comparisons with each control (D). Brightfield (A-B, F, H), fluorescence (G, I). P-values: ** P = 0.001>0.005, **** P = <0.0001. ED, Endoskeletal disc; MFF, Median fin fold. Scale bars: 100μm (F-I).