Fig. 3
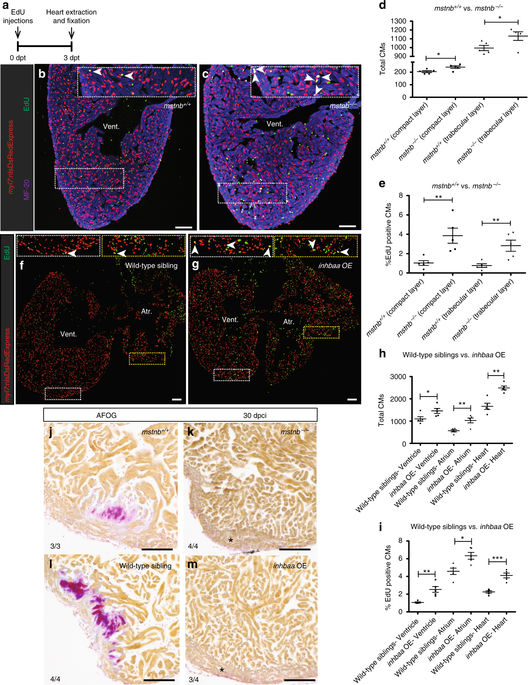
mstnb LOF and inhbaa GOF positively affect physiological CM proliferation and cardiac regeneration. a Experimental setup of EdU treatment, followed by heart extraction and fixation. b, c Sections of mstnb +/+ and mstnb −/− adult hearts in Tg(myl7:nlsDsRedExpress) background; α-DsRed (red), MF-20 (blue), EdU (green). Higher magnifications of dashed boxes in b, c are shown in upper right corners. White arrowheads point to EdU+/DsRed+ CMs. d, e Quantification of total CMs (DsRed+) and EdU incorporating CMs (EdU+/DsRed+) in the compact and trabecular layers of mstnb +/+ (n = 5) and mstnb −/− (n = 5) ventricles. f, g Sections of wild-type sibling and inhbaa OE adult hearts in Tg(myl7:nlsDsRedExpress) background; α-DsRed (red), EdU (green). Higher magnifications of dashed boxes in f, g are shown in upper left and upper right corners. h, i Quantification of total CMs (DsRed+) and EdU incorporating CMs (EdU+/DsRed+) in wild-type sibling (n = 5) and inhbaa OE (n = 5) hearts. All cell counts were performed on three sections from each heart. Each data point on dot plot represents one heart (data are mean ± s.e.m., *P ≤ 0.05, **P ≤ 0.01, ***P ≤ 0.001—Student’s t test, two-tailed). j–m AFOG staining of sections from mstnb +/+ (n = 3), mstnb −/− (n = 4), wild-type sibling (n = 4), and inhbaa OE (n = 4) cryoinjured hearts at 30 dpci. Asterisks indicate the regions of resolved scarring. The numerators indicate the number of hearts with a particular pattern of scarring, and the denominators the total number of hearts analyzed. Scale bars, 100 µm. dpt, days post treatment; vent., ventricle; atr., atrium

