Fig. 1
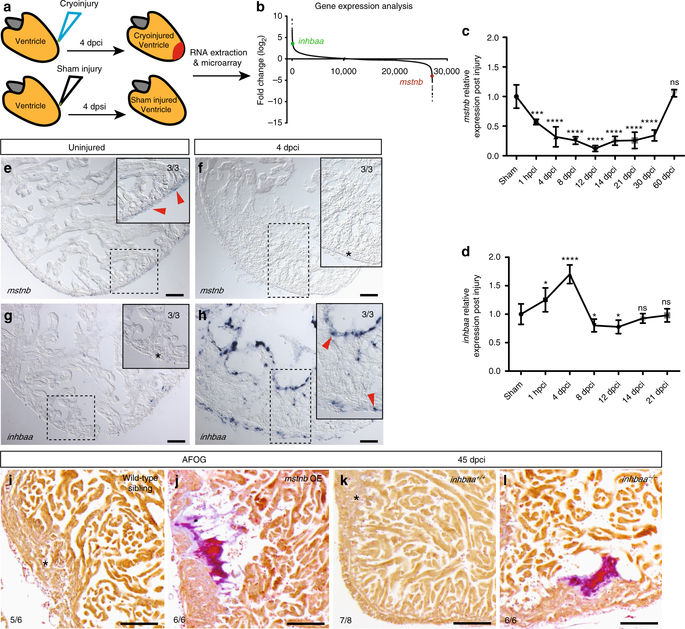
mstnb and inhbaa have opposing response and functions during zebrafish cardiac regeneration. a Schematic representation of injury and sample preparation for microarray analysis (n = 12 hearts). b Averaged transcriptional gene expression changes post cryoinjury as assessed by microarray analysis (inhbaa and mstnb indicated). c, d Temporal RT-qPCR analysis for mstnb and inhbaa expression post cryoinjury (n = 2 × 3 cardiac ventricles assessed as two biological and two technical replicates for each time point, data are mean ± s.e.m., ns: no significant changes observed, *P ≤ 0.05, ***P ≤ 0.001, and ****P ≤ 0.0001—Student’s t test, two-tailed). e–h In situ hybridization for mstnb and inhbaa expression on uninjured and 4 dpci adult zebrafish heart sections. Higher magnifications of dashed boxes in e–h are shown in upper right corners. RNA probe signal is indicated by red arrowheads and the absence of signal is indicated by asterisks. The numerators indicate the number of hearts with a particular pattern of signal, and the denominators the total number of hearts analyzed. i–l AFOG staining of sections from wild-type sibling, mstnb OE, inhbaa +/+, and inhbaa −/− cryoinjured hearts at 45 dpci. Healthy myocardium in orange, fibrin in red, collagen in blue. Asterisks indicate the regions of resolved scarring. The numerators indicate the number of hearts with a particular pattern of scarring, and the denominators the total number of hearts analyzed. Scale bars: in situ hybridization images, 50 µm; AFOG staining images, 100 µm

