
|
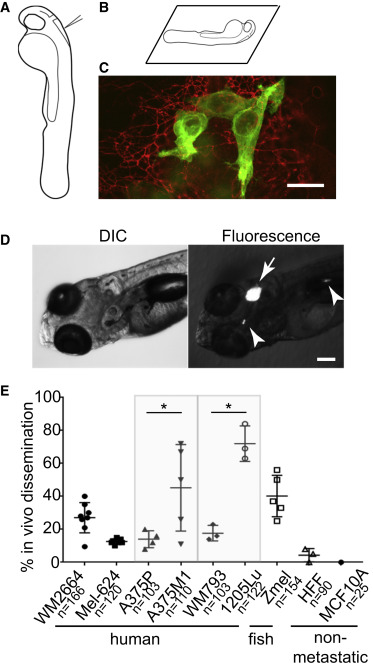
Fig. 1 Human Melanoma Cells Disseminate from the Site of Transplantation (A and B) Schematic of zebrafish hindbrain ventricle transplantation and imaging strategy. (C) Confocal z projection of fixed larvae in which melanoma cells (GFP immunostaining, green) are dorsal to the choroid plexus, within the skin (ZO-1 immunostaining, red). Scale bar, 20 μm. See also Figure S1 and Movie S1. (D) Left: DIC image of anterior region of 6dpf zebrafish larva on left. Right: fluorescence image of same larva showing transplanted tumor (arrow) and disseminated cells (arrowheads). Scale bar, 100 μm. (E) Quantification of tumor cell dissemination in vivo in which each point is a single experiment comprising of 20–40 larvae. n indicates total number of zebrafish scored. Gray boxes indicate matched pairs of primary tumor-derived cell lines (A375P and WM793), and cell lines derived from metastases of those parental tumors (A375M1 and 1205Lu). Error bars are mean ± SD. One-way ANOVA (p < 0.0001), followed by non-parametric unpaired t test (p = 0.05 [between A375P and A375M1], p = 0.01 [between WM793 and 1205Lu]). Asterisks indicate p < 0.05.
Reprinted from Developmental Cell, 43, Roh-Johnson, M., Shah, A.N., Stonick, J.A., Poudel, K.R., Kargl, J., Yang, G.H., di Martino, J., Hernandez, R.E., Gast, C.E., Zarour, L.R., Antoku, S., Houghton, A.M., Bravo-Cordero, J.J., Wong, M.H., Condeelis, J., Moens, C.B., Macrophage-Dependent Cytoplasmic Transfer during Melanoma Invasion In Vivo, 549-562.e6, Copyright (2017) with permission from Elsevier. Full text @ Dev. Cell