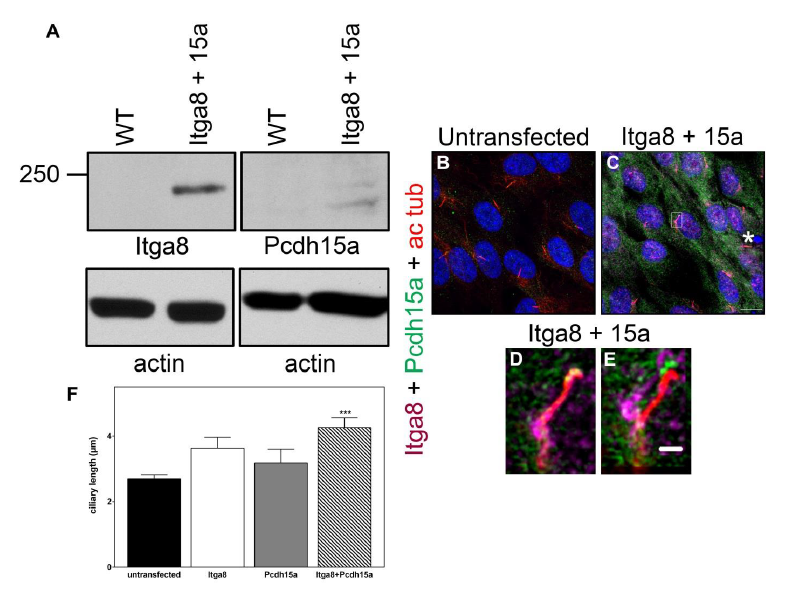
Fig. s5 Iga8/Pcdh15a complex regulates ciliogenesis in hTERT-RPE cells. A: Immunoblots of untransfected (WT) and co-transfected cells with Itga8 and Pcdh15a (Itga8 + 15a). WT cells do not express human Itga8 or Pcdh15a, corroborated by RTPCR and western blot analysis (data not shown). Membranes were stripped and reprobed for actin as loading control. B-E: Immunofluorescence of untransfected (B) or co-transfected (C-E) cells. Cells were co-immunostained for Itga8 (magenta), Pcdh15a (green) and acetylated tubulin (red). Asterisk denotes another cilia positive for Itga8 and Pcdh15a. D: Magnification of the boxed area in C. E: Channel shifted image of D. B-C: 10µm, D-E: 1µm. F: Ciliary length averages from three independent experiments in untransfected cells, Itga8 transfected cells, Pcdh15a transfected cells and cotransfected cells. In the case of transfected cells, measurements were performed in cilia that were positive for Itga8, Pcdh15a or both accordingly. One-way ANOVA followed by Dunnett’s multiple comparisons test. ***p<0.001 versus control.
Image
Figure Caption
Acknowledgments
This image is the copyrighted work of the attributed author or publisher, and
ZFIN has permission only to display this image to its users.
Additional permissions should be obtained from the applicable author or publisher of the image.
Full text @ J. Cell Sci.

