Image
Figure Caption
Fig. 3
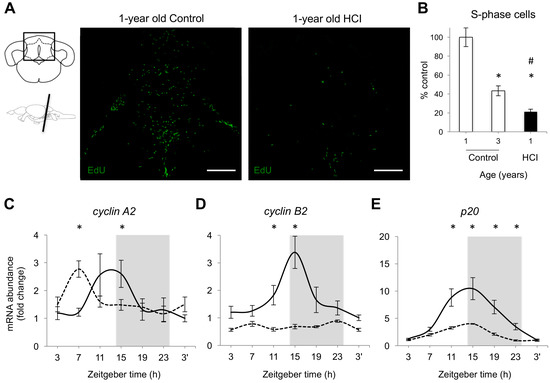
Figure 3. Chronic high caloric intake inhibits adult neurogenesis and expression of cell cycle regulators in brain tissue of 1-year old zebrafish. (A) Left: schematics showing cerebellar sections with boxes identifying areas presented in the images along with schematic of zebrafish brain identifying coronal planes at which the brain was cut; Right: representative images of the total number of 5-Ethynyl-2′-deoxyuridine (EdU) positive cells (S-phase), green, in Control and HCI fish at ZT11, following 2-h EdU exposure, intraperitoneal (i.p.) injection, Scale: 180 μm. (B) Percent cells in S-phase in 3-year old Control (white bar) and 1-year old HCI (black bar), relative to mean levels in 1-year old Control (100%, white bar); * p < 0.05 vs. 1-year old Control and # p < 0.05 vs. 3-year old Control; (C–E) Daily patterns of mRNA abundance for cyclins A2 and B2, and p20 in 1-year old Control (solid line) and HCI fish (dashed line); n = 5–6 fish per each data point; mean ± SEM, * p < 0.05 HCI vs. Control at specific time points. Grey background—night, 14:10 LD cycle. Zeitgeber time of sample collection, ZT0 = lights-on time.
Figure Data
Acknowledgments
This image is the copyrighted work of the attributed author or publisher, and
ZFIN has permission only to display this image to its users.
Additional permissions should be obtained from the applicable author or publisher of the image.
Full text @ Int. J. Mol. Sci.

