
Image
|
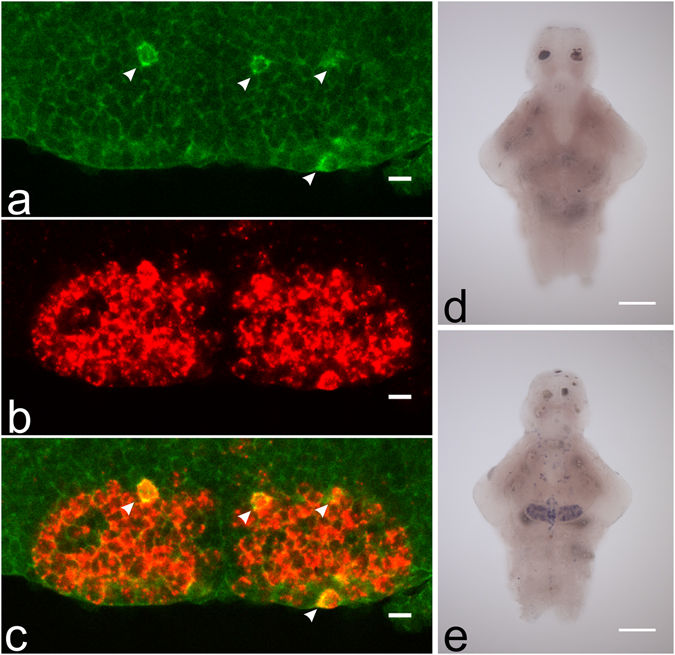
Figure Caption
Fig. 5
Expression of vmat1, vmat2 and hdc in the hypothalamus. Virtually all hdc mRNA positive neurons seen (green, pointed out by white arrows) also express vmat2 mRNA (red) (a–c). n = 6 brains, representative single optical sections from one sample are shown. Red signal is developed using TAMRA tyramide and green signal using DY-647P1 tyramide. We found no expression of vmat1 in the zebrafish brain (d), although vmat2 was present in multiple brain regions (e). Scale bar 10 µm for (a–c) and 100 µm for (d–e).
Acknowledgments
This image is the copyrighted work of the attributed author or publisher, and
ZFIN has permission only to display this image to its users.
Additional permissions should be obtained from the applicable author or publisher of the image.
Full text @ Sci. Rep.