
|
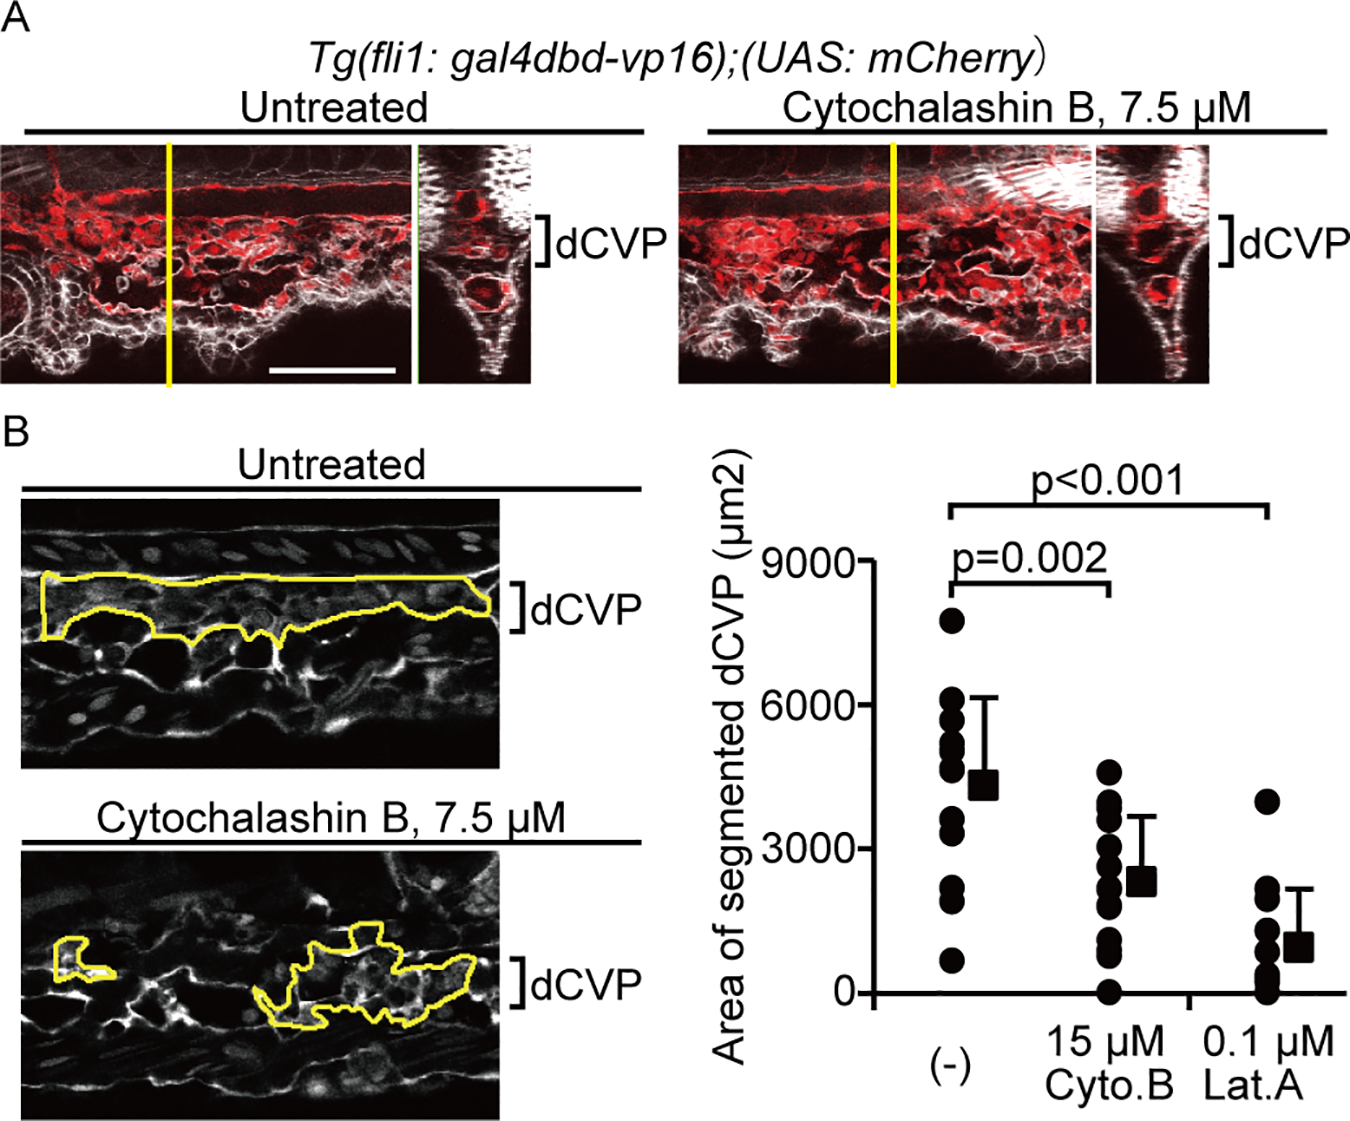
Fig. 7
Actin polymerization is required for dCVP regression.
(A) Image of phalloidin stain (white) merged with the mCherry signal (red) in indicated embryos treated with 0 μM or 7.5 μM Cytochalashin B from 30–37 are shown. Scale bars: 100 μm. (B) Representative images for gating of the segmented dCVP area in embryos are shown. The Tg(fli1: gal4dbd-vp16);(UAS: mCherry) embryos treated with 15 μM Cytochalasin B (Cyto.B) or 0.1 μM Latrunculin A (Lat.A) from 30–37 hpf. White color shows mCherry signals. Scale bars: 50 μm. The area of segmented dCVP, gated as indicated in (B) were quantified. The numbers of embryos analyzed are shown at the top of each bar. Each dot represents one embryo, and solid squares and error bars indicate means and SDs.