
Image
|
Figure Caption
Fig. 4
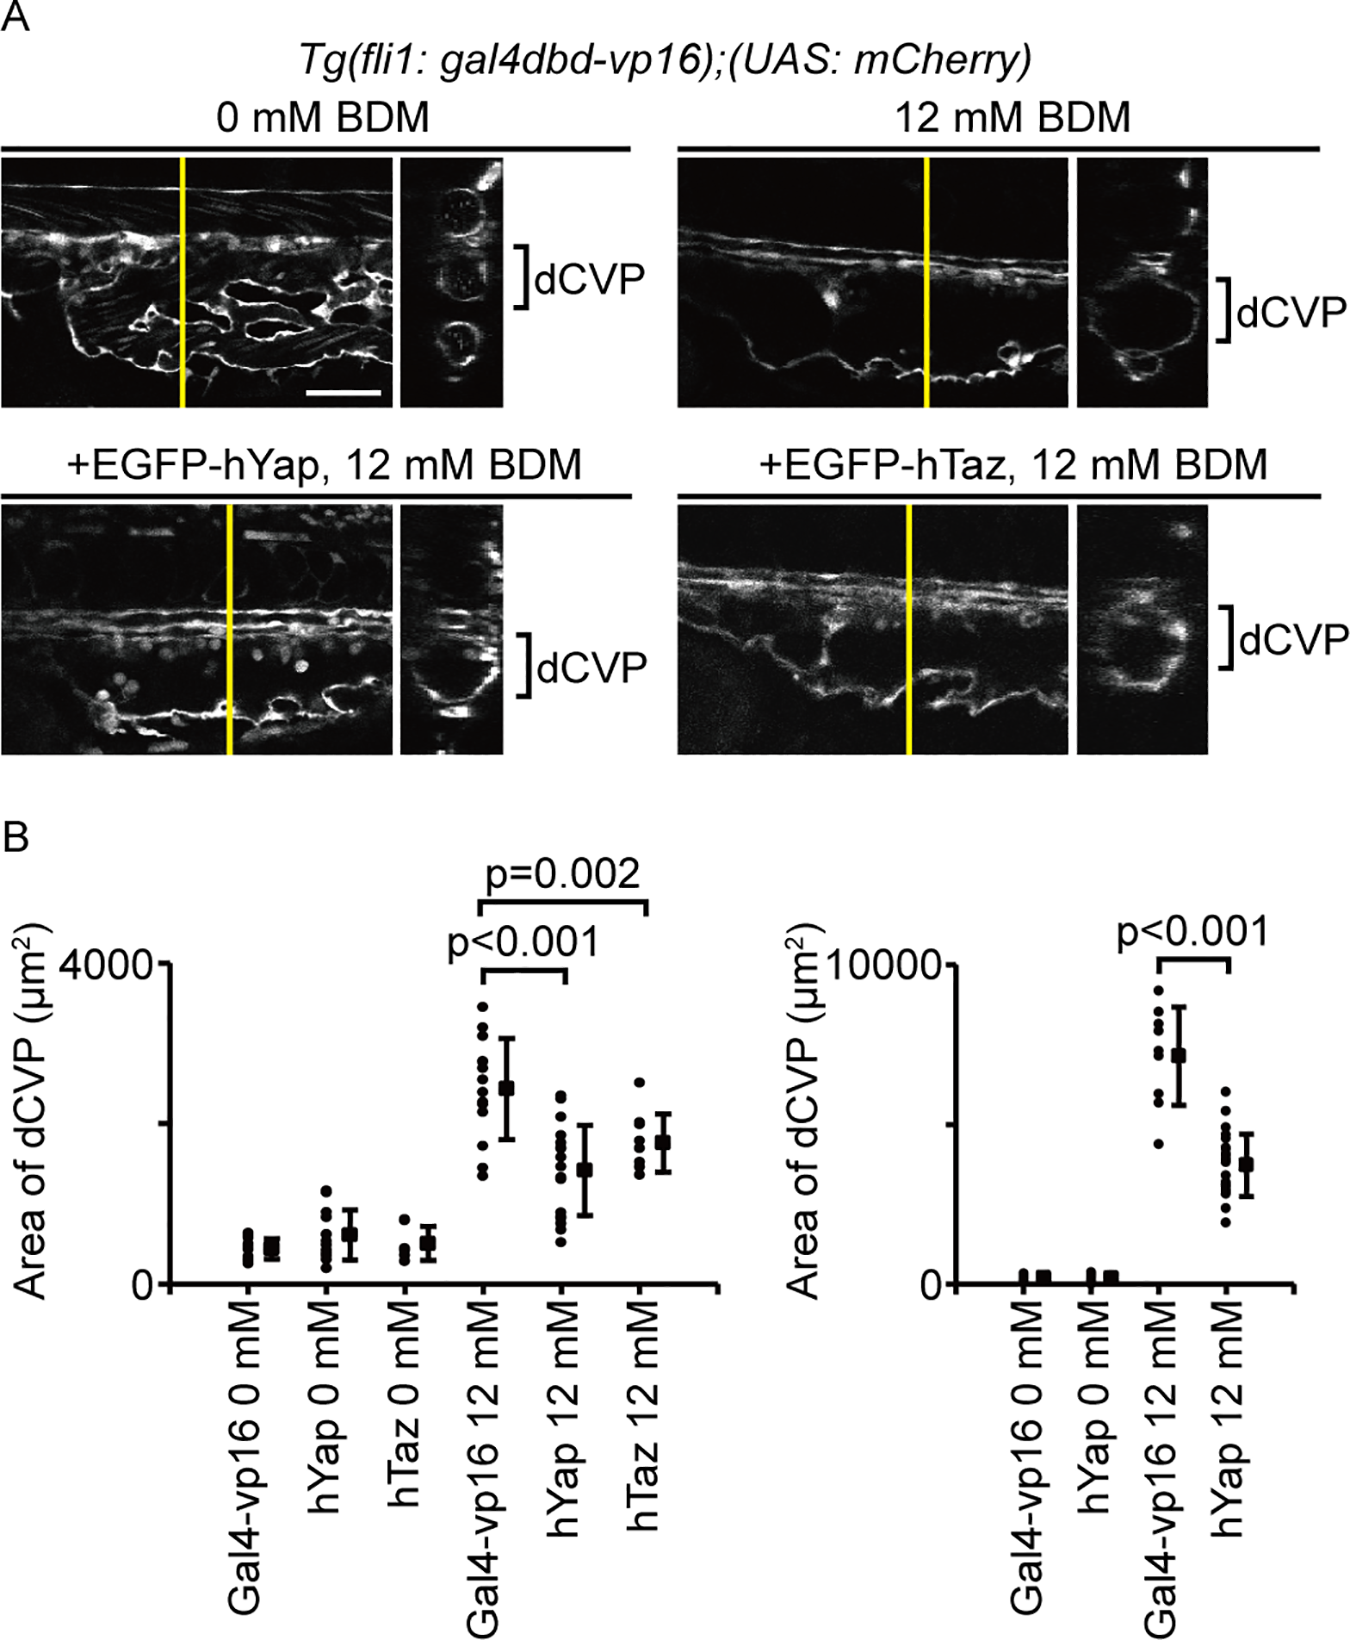
Yap/Taz transcriptional activity controls vascular shrinking during dCVP regression.
(A) Embryos were treated with or without 12 mM BDM from 28–36 hpf. Lateral single-slice images of the CVP region in indicated embryos at 36 hpf are shown. Cross-sectional images in the plane indicated by the yellow lines are shown to the right. White color shows mCherry signals. Scale bars: 100 μm. (B) Embryos were treated with or without 12 mM BDM from 28–36 hpf and 28–48 hpf, respectively. Each dot represents one embryo, and solid squares and error bars represent means and SDs.
Acknowledgments
This image is the copyrighted work of the attributed author or publisher, and
ZFIN has permission only to display this image to its users.
Additional permissions should be obtained from the applicable author or publisher of the image.
Full text @ PLoS One