
|
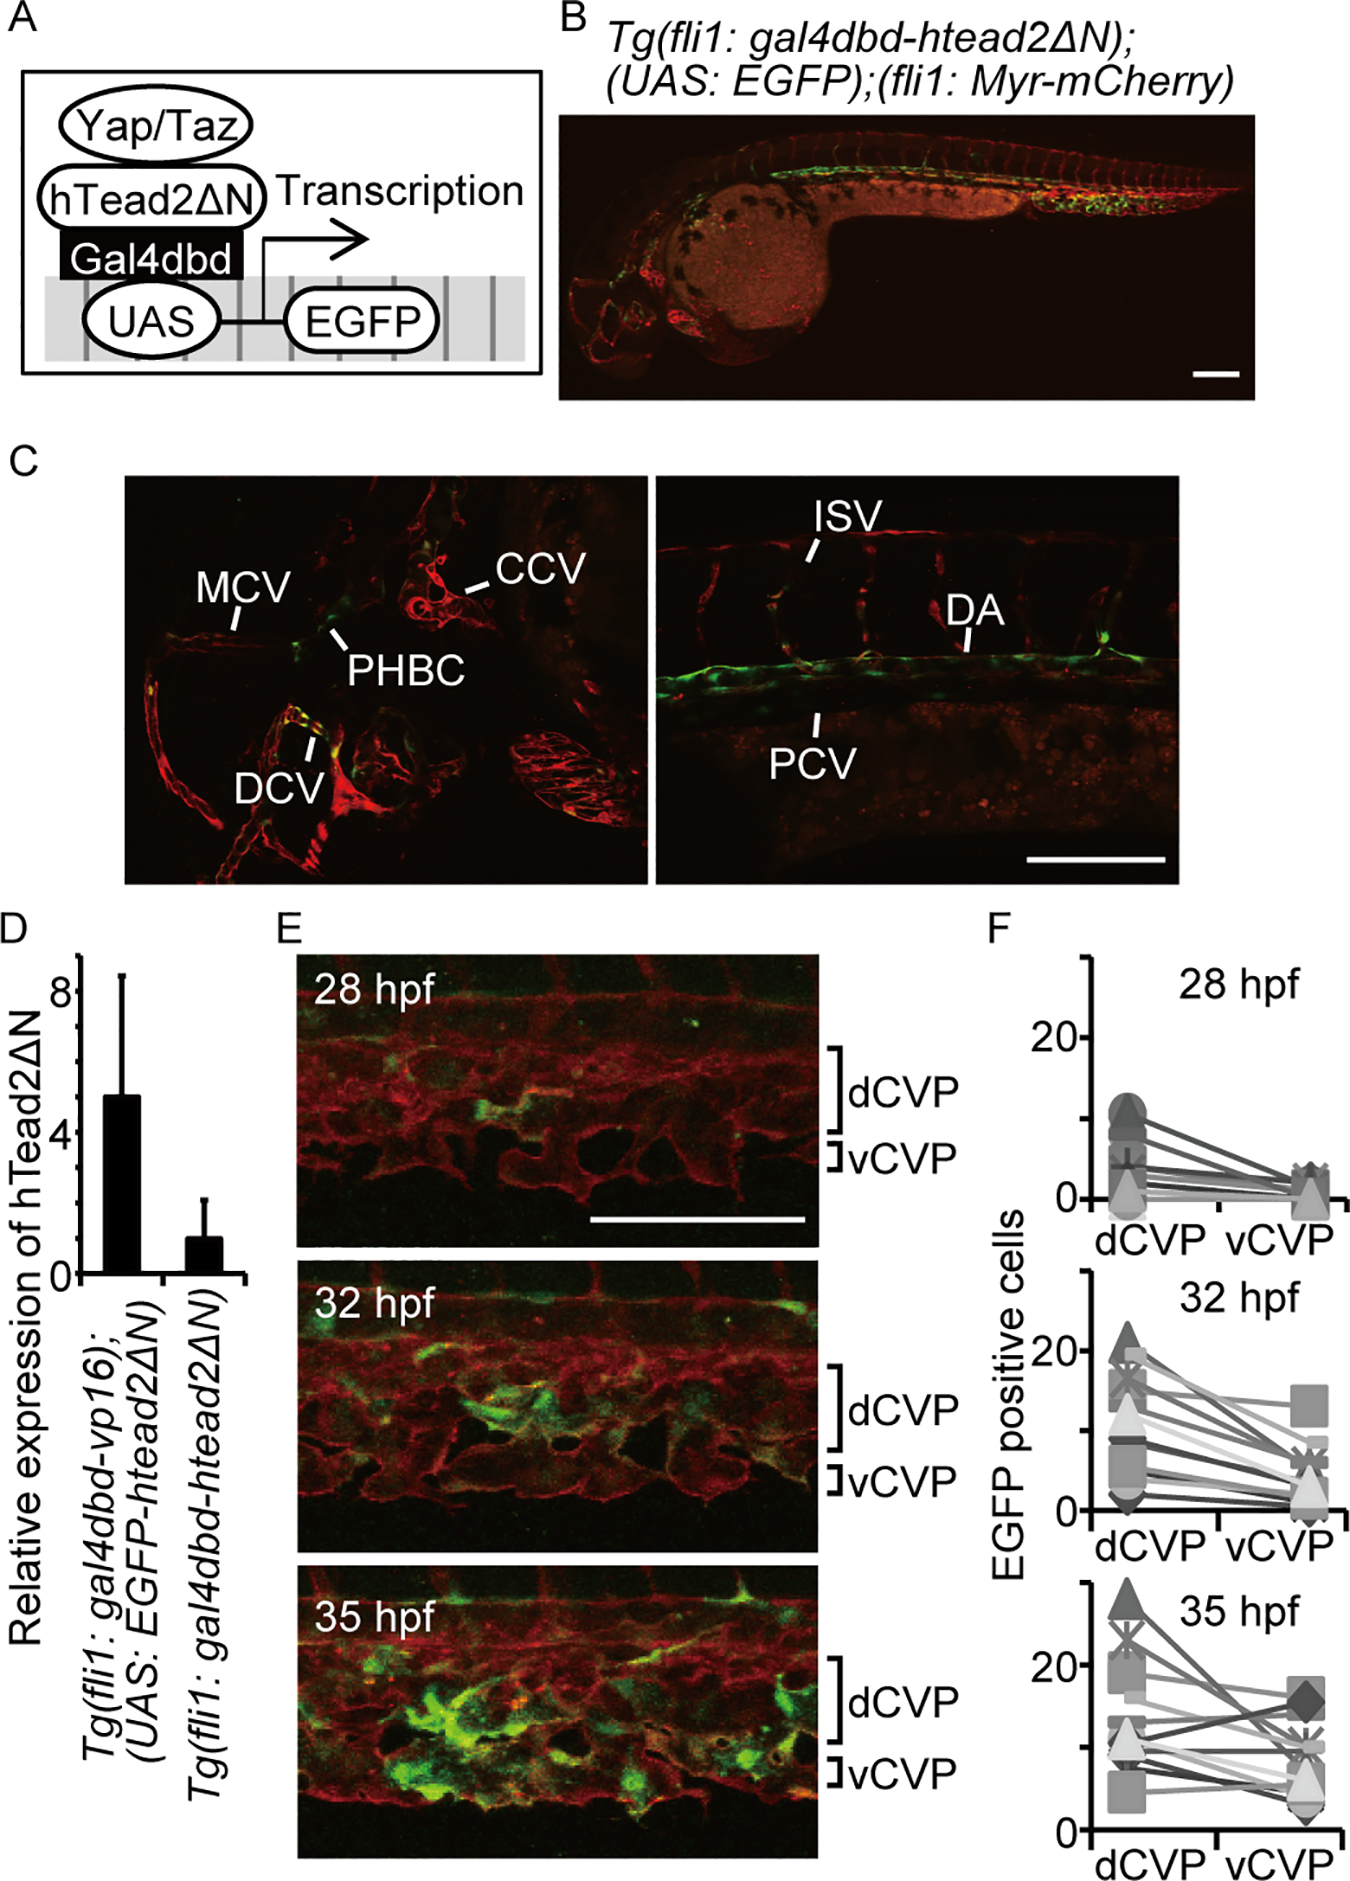
Fig. 2
Yap/Taz is transactivated in the CVP during dCVP regression.
(A) Schema for detecting Yap/Taz transcriptional activity is shown. (B and C) Confocal stack image of a Tg(fli1: gal4dbd-htead2ΔN);(UAS: EGFP);(fli1: Myr-mCherry) embryo at 36 hpf is shown. The EGFP signal is shown in green and mCherry in red. Scale bar: 100 μm. Enlarged images in (B) are also shown: head (left), dorsal area (right). CCV, common cardinal vein; PHBC, primordial hindbrain channel; DCV, dorsal ciliary vein; MCV, middle cerebral vein; DA, dorsal aorta; PCV, posterior cardinal vein. (D) The relative expression of hTead2ΔN mRNA in the indicated embryos are shown. Data are means and SDs (n = 3). (E and F) Representative images of the indicated embryo are shown. Scale bar: 100 μm. The numbers of EGFP-positive cells were counted in the dCVP and vCVP from 12 embryos.