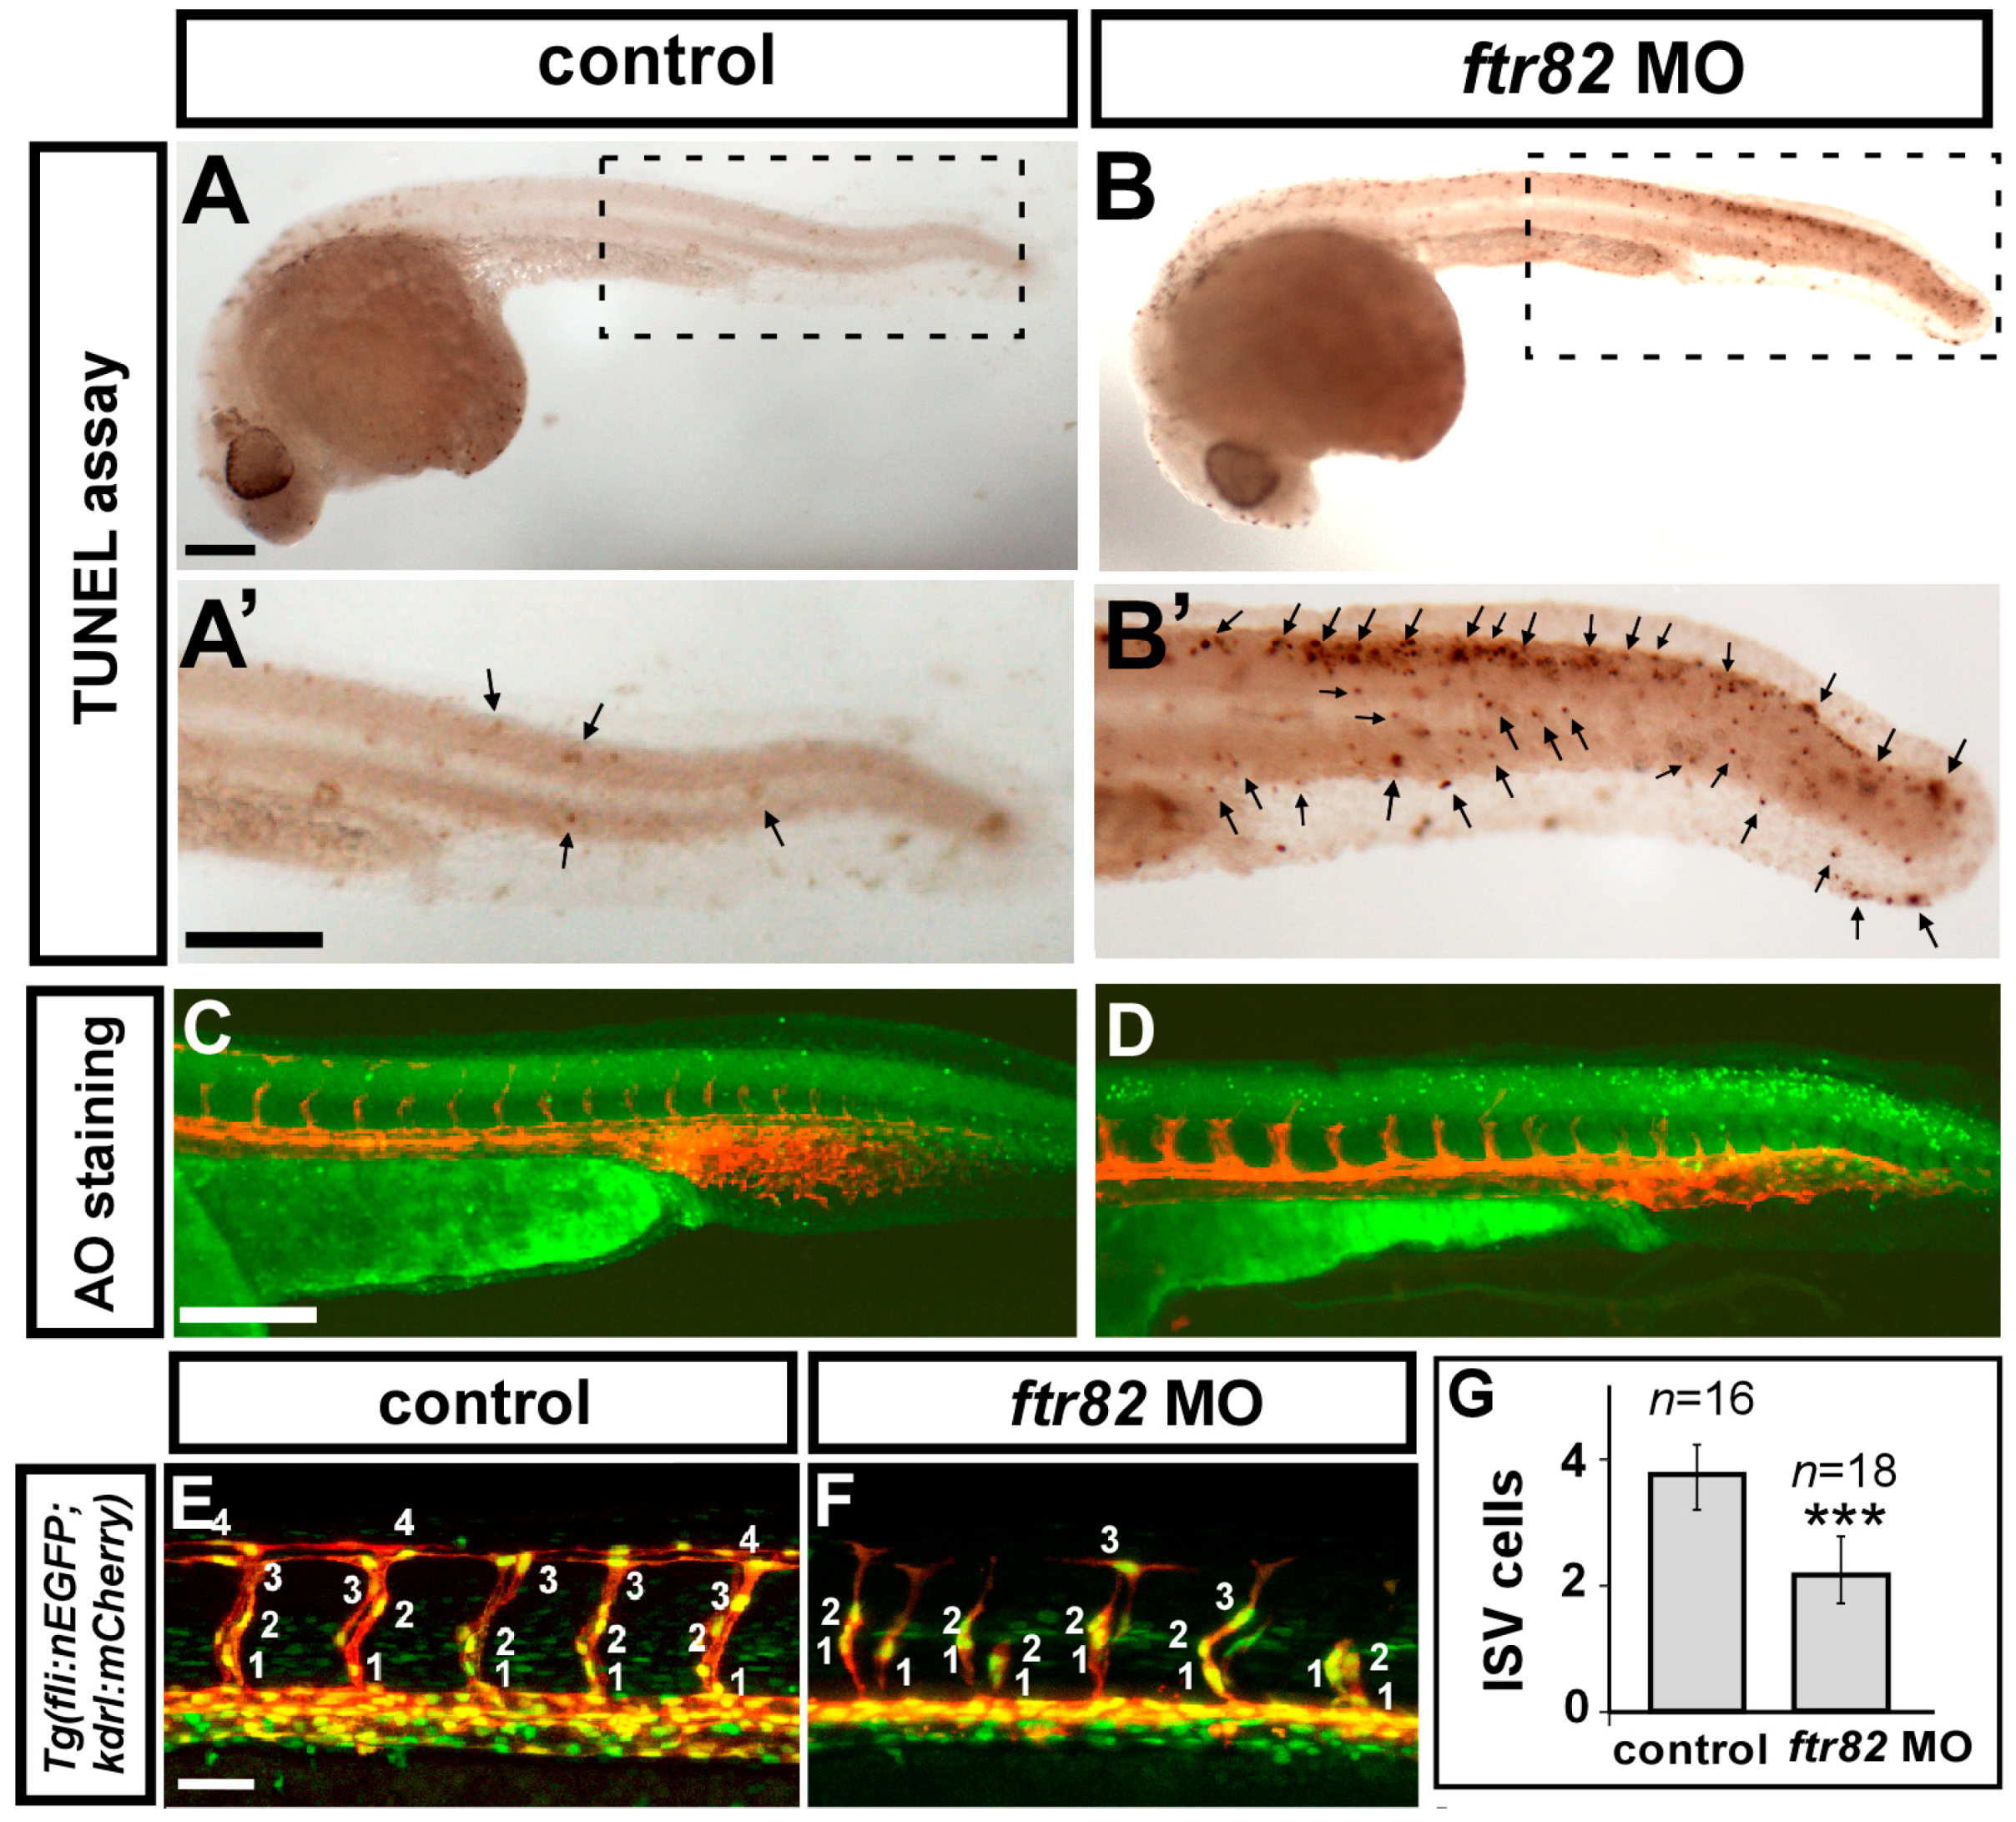
Fig. 5
Loss of ftr82 impairs the growth of ISV cells. (A,A’,B,B’) TdT-mediated dUTP-X nick end labeling (TUNEL) assay was used to detect apoptotic cells in uninjected control and ftr82e1i1 morphants. Increased apoptotic cells were observed on the skin and in the epidermis of the dorsal tail region (arrows), but not in vascular regions in ftr82 MO compared to controls at 28 hpf; (A’,B’) are expanded images of (A) and (B), respectively; (C,D) AO staining (green dots) in Tg (kdrl:mCherry) fish exhibited more apoptotic cells with the knockdown of ftr82; (E,F) The number of cells forming each ISV counted in control Tg (kdrl:mCherryci5; fli1a:negfp y7) (E) and ftr82 morphant embryos (F) at 32 hpf; (G) Quantification of average ISV cells per ISV counted in both control (n = 16) and ftr82 morphant (n = 18); (H–L) migration assay measured the difference of ISV length from 24 to 28 hpf in control and ftr82 MO (n = 30 ISVs from three control embryos or morphants); (M,N) Proliferation marker pHH3 was counted in the trunk region beneath the neural tube and above the yolk extension area, where it is more related to main vessels and ISVs; (O) The mean number of mitotic cells (phosphohistone H3, pHH3 cells) in control was 16.3 ± 2.4 (n = 8) and in ftr82 MO was 7.5 ± 2.1 (n = 8); (P) Western blot analysis showed the reduced expression level of pHH3; the increase of p21 and p27 protein levels. β-actin serves as a loading control. Scale bars are 200 μm for (A–D,A’,B’,M,N) and 50 μm for (E,F,H–K). *** refers to p < 0.0001 by an unpaired Student’s t-test.

