Fig. 3
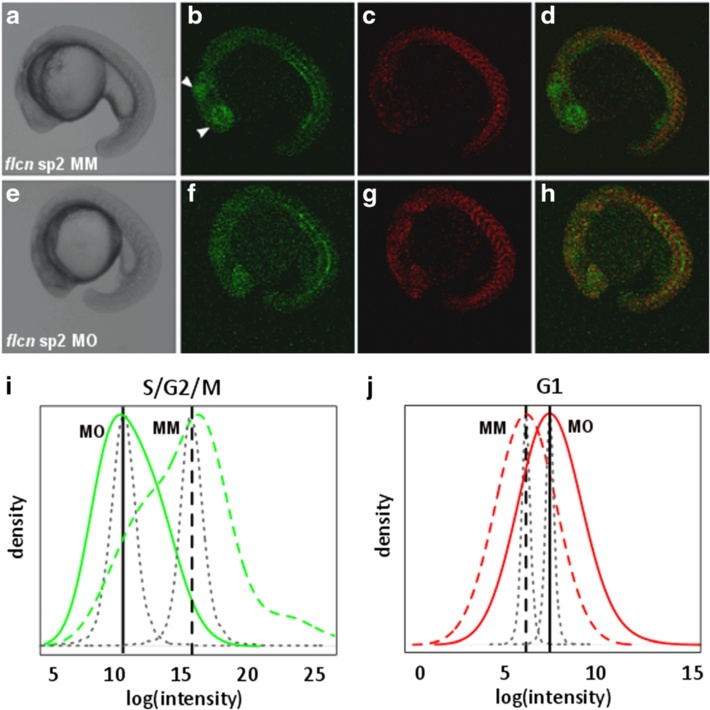
Cell cycle defects in flcn morphant embryos at 18 somite stage of development. Zebrafish Fucci embryo injected with flcn sp2 mismatch control morpholino imaged in (a) Brightfield, (b) fluorescence for Geminin-Azami Green (S/G2/M phase), (c) fluorescence for Cdt1-Kusabira Orange2 and (d) fluorescence merge of Geminin-Azami Green (S/G2/M phase) and Cdt1- Kusabira Orange2 (G1). Zebrafish Fucci embryo injected with flcn sp2 morpholino imaged in (e) Brightfield, (f) fluorescence for Geminin-Azami Green (S/G2/M phase), (g) fluorescence for Cdt1-Kusabira Orange2 and (h) fluorescence merge of Geminin-Azami Green (S/G2/M phase) and Cdt1- Kusabira Orange2 (G1). i Pixel intensity of Geminin-Azami Green in embryos injected with flcn sp2 mopholino injected embryos (solid green line (MO)) when compared with flcn sp2 mismatch control morpholino injected embryos (dashed green line (MM)). Green lines show empirical log(intensity) data distributions. j Pixel intensity of Cdt1-Kusabira Orange2 in embryos injected with flcn sp2 mopholino injected embryos (solid red line (MO)) when compared with flcn sp2 mismatch control morpholino injected embryos (dashed red line (MM)). Red lines show empirical log(intensity) data distributions. Vertical, black lines indicate means, with parameter confidence distributions shown as curved black lines. Vertical, black lines indicate means, with parameter confidence distributions shown as curved black lines

