Fig. 1
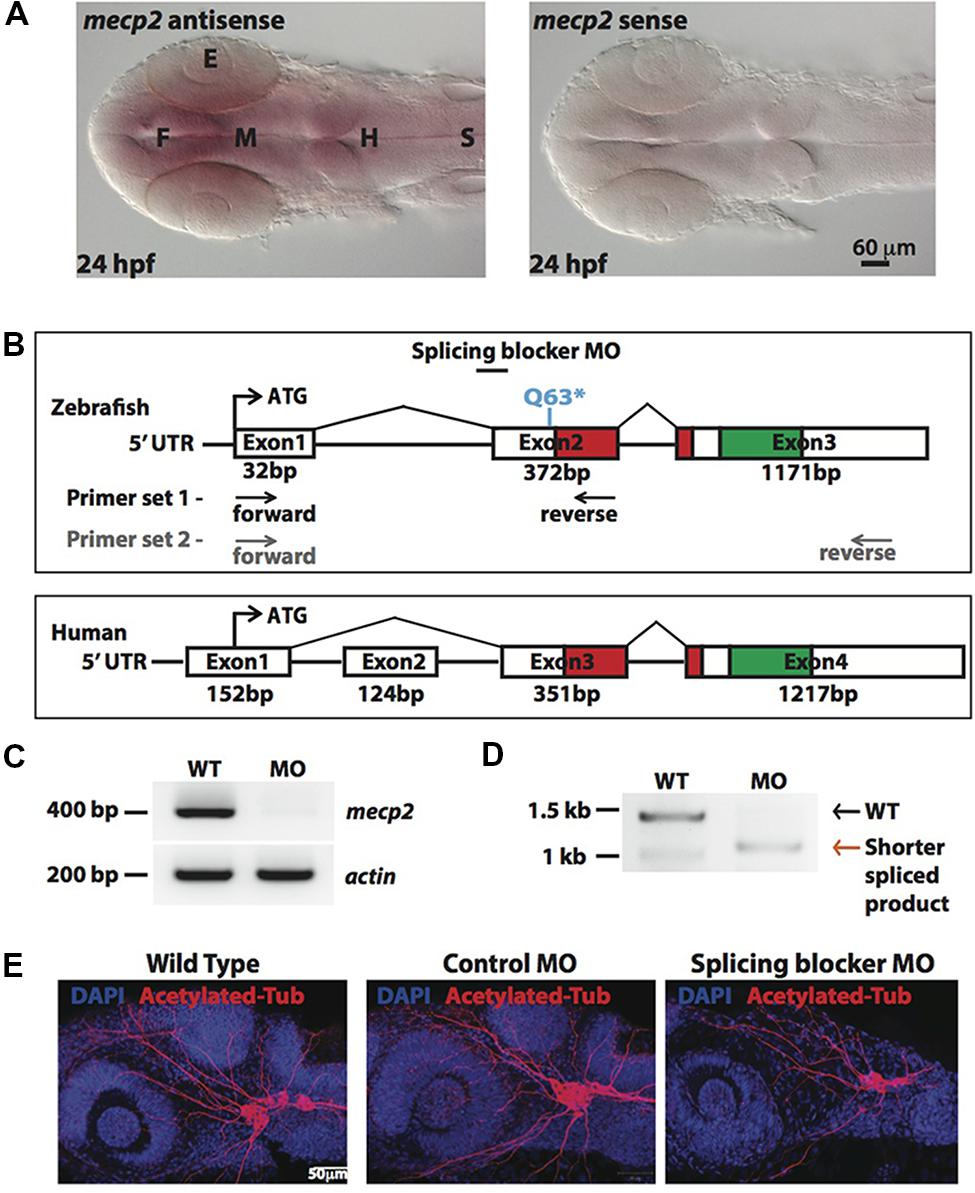
FIGURE 1. Knocking down Mecp2 in zebrafish. Mecp2 is ubiquitously expressed throughout the CNS at 24 hpf (A). The embryos are displayed as whole mounts, dorsal view (F- forebrain, M - midbrain and H-hindbrain, S - spinal cord, E- eye) Scale bar = 60 μm. Schematic diagram shows gene structure of the zebrafish mecp2 and the mammalian (human or mouse) MeCP2α isoform (B). The zebrafish mecp2 gene consists of 3 exons with the main domains highlighted in red (Methyl-CpG-binding domain) and green (transcriptional repressor domain). The splice blocking morpholino targets the intron 1/exon 2 boundary on mecp2 pre-mRNA. Arrows below Zebrafish mecp2 gene show the positions where the forward and reverse primers were targeted [primer set 1 with black arrows for experiment in (C) and primer set 2 with gray arrows for (D)]. The specificity of morpholino was determined by RT-PCR (B,C). Representative gel images showing normal splicing of mecp2 as a band of 400 bp with actin (206 bp) as the control (C). Representative gel image showing normal splicing of mecp2 in WT (1455 bp) or blocked splicing band (exon skipping) (1086 bp) in mecp2 spliced MO injected embryos (D). Representative images showing gross morphological changes in TG neurons projections induced by mecp2 MO during development of zebrafish at 24 hpf (E). Scale bar = 50 μm.

