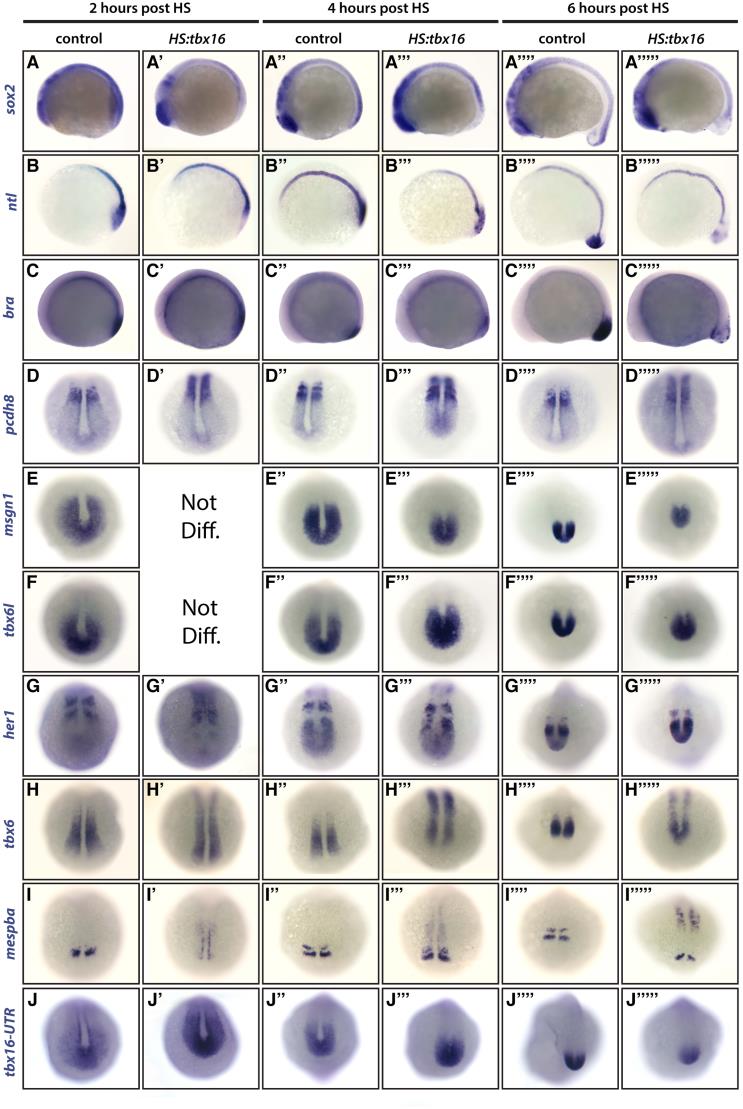
Fig. S3
Gene expression after heat shock activation of HS:tbx16. Whole mount in situ hybridization data used for the summary of changes to genes after the expression of ectopic tbx16 (shown in Figure 2A). Because of the large number of embryos screened for this analysis, transgenic embryos were not separated from their nontransgenic siblings prior to in situ hybridization. A minimum of 30 embryos was used for each condition. In all cases except where noted as Not Diff. (not different), approximately 50% of the embryos matched previously published wild-type expression patterns and 50% showed the altered pattern. See Table S1 for quantification of the results.

