Image
Figure Caption
Fig. S3
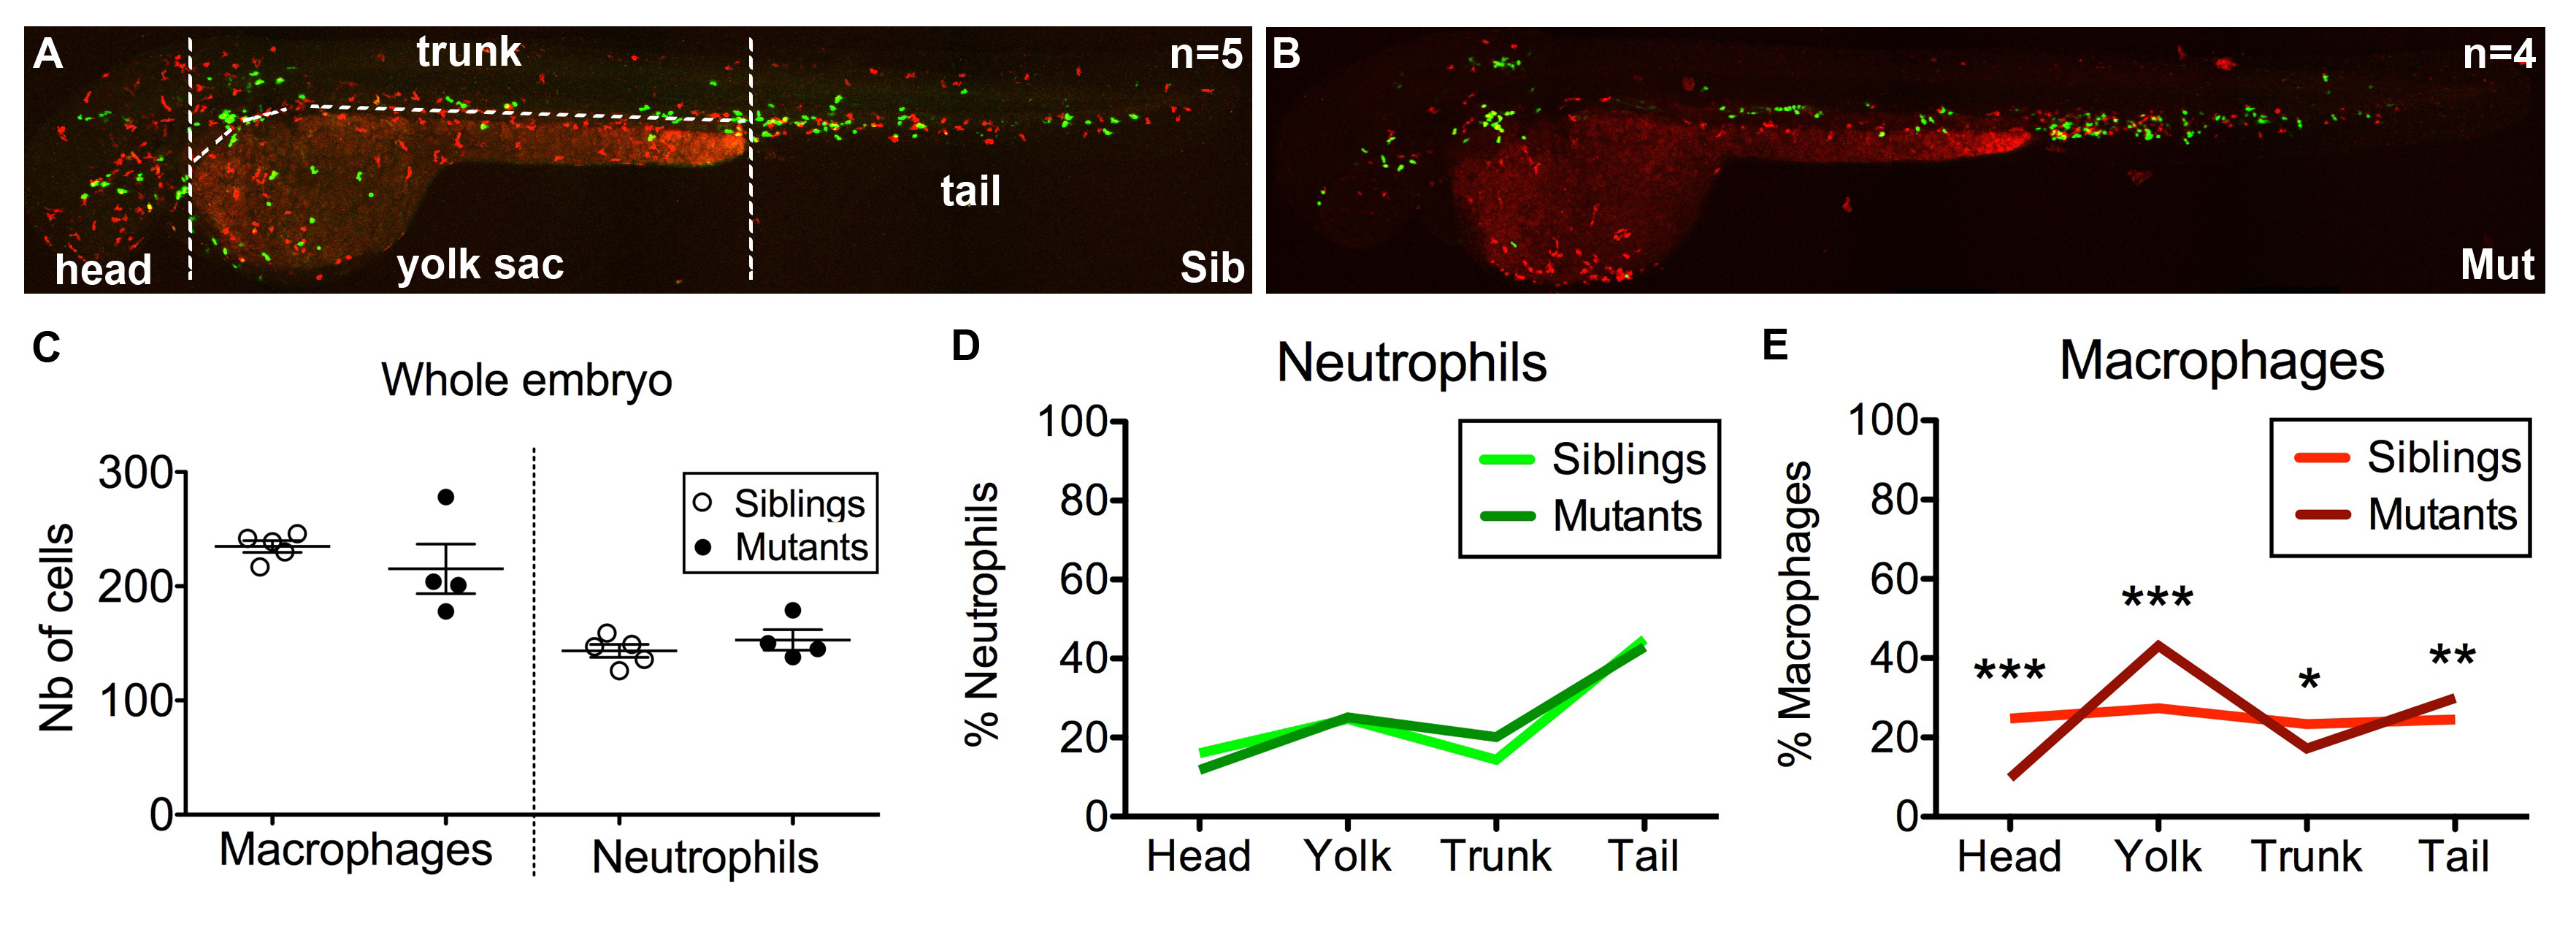
Distribution of macrophages and neutrophils in moonshine vs. sibling zebrafish embryos. (A,B) In vivo images of monNQ039Tg(mpeg1:mCherryF; mpx:GFP) sibling (A) and mutant (B) embryos at 2 dpf. (C) Total counts of macrophages and neutrophils in siblings (n=5) and mutant (n=4) embryos. (D,E) Distribution (in %) of neutrophils (D) and macrophages (C) among the four regions in which each embryo was subdivided as indicated in (A).
Figure Data
Acknowledgments
This image is the copyrighted work of the attributed author or publisher, and
ZFIN has permission only to display this image to its users.
Additional permissions should be obtained from the applicable author or publisher of the image.
Full text @ J. Cell Sci.

