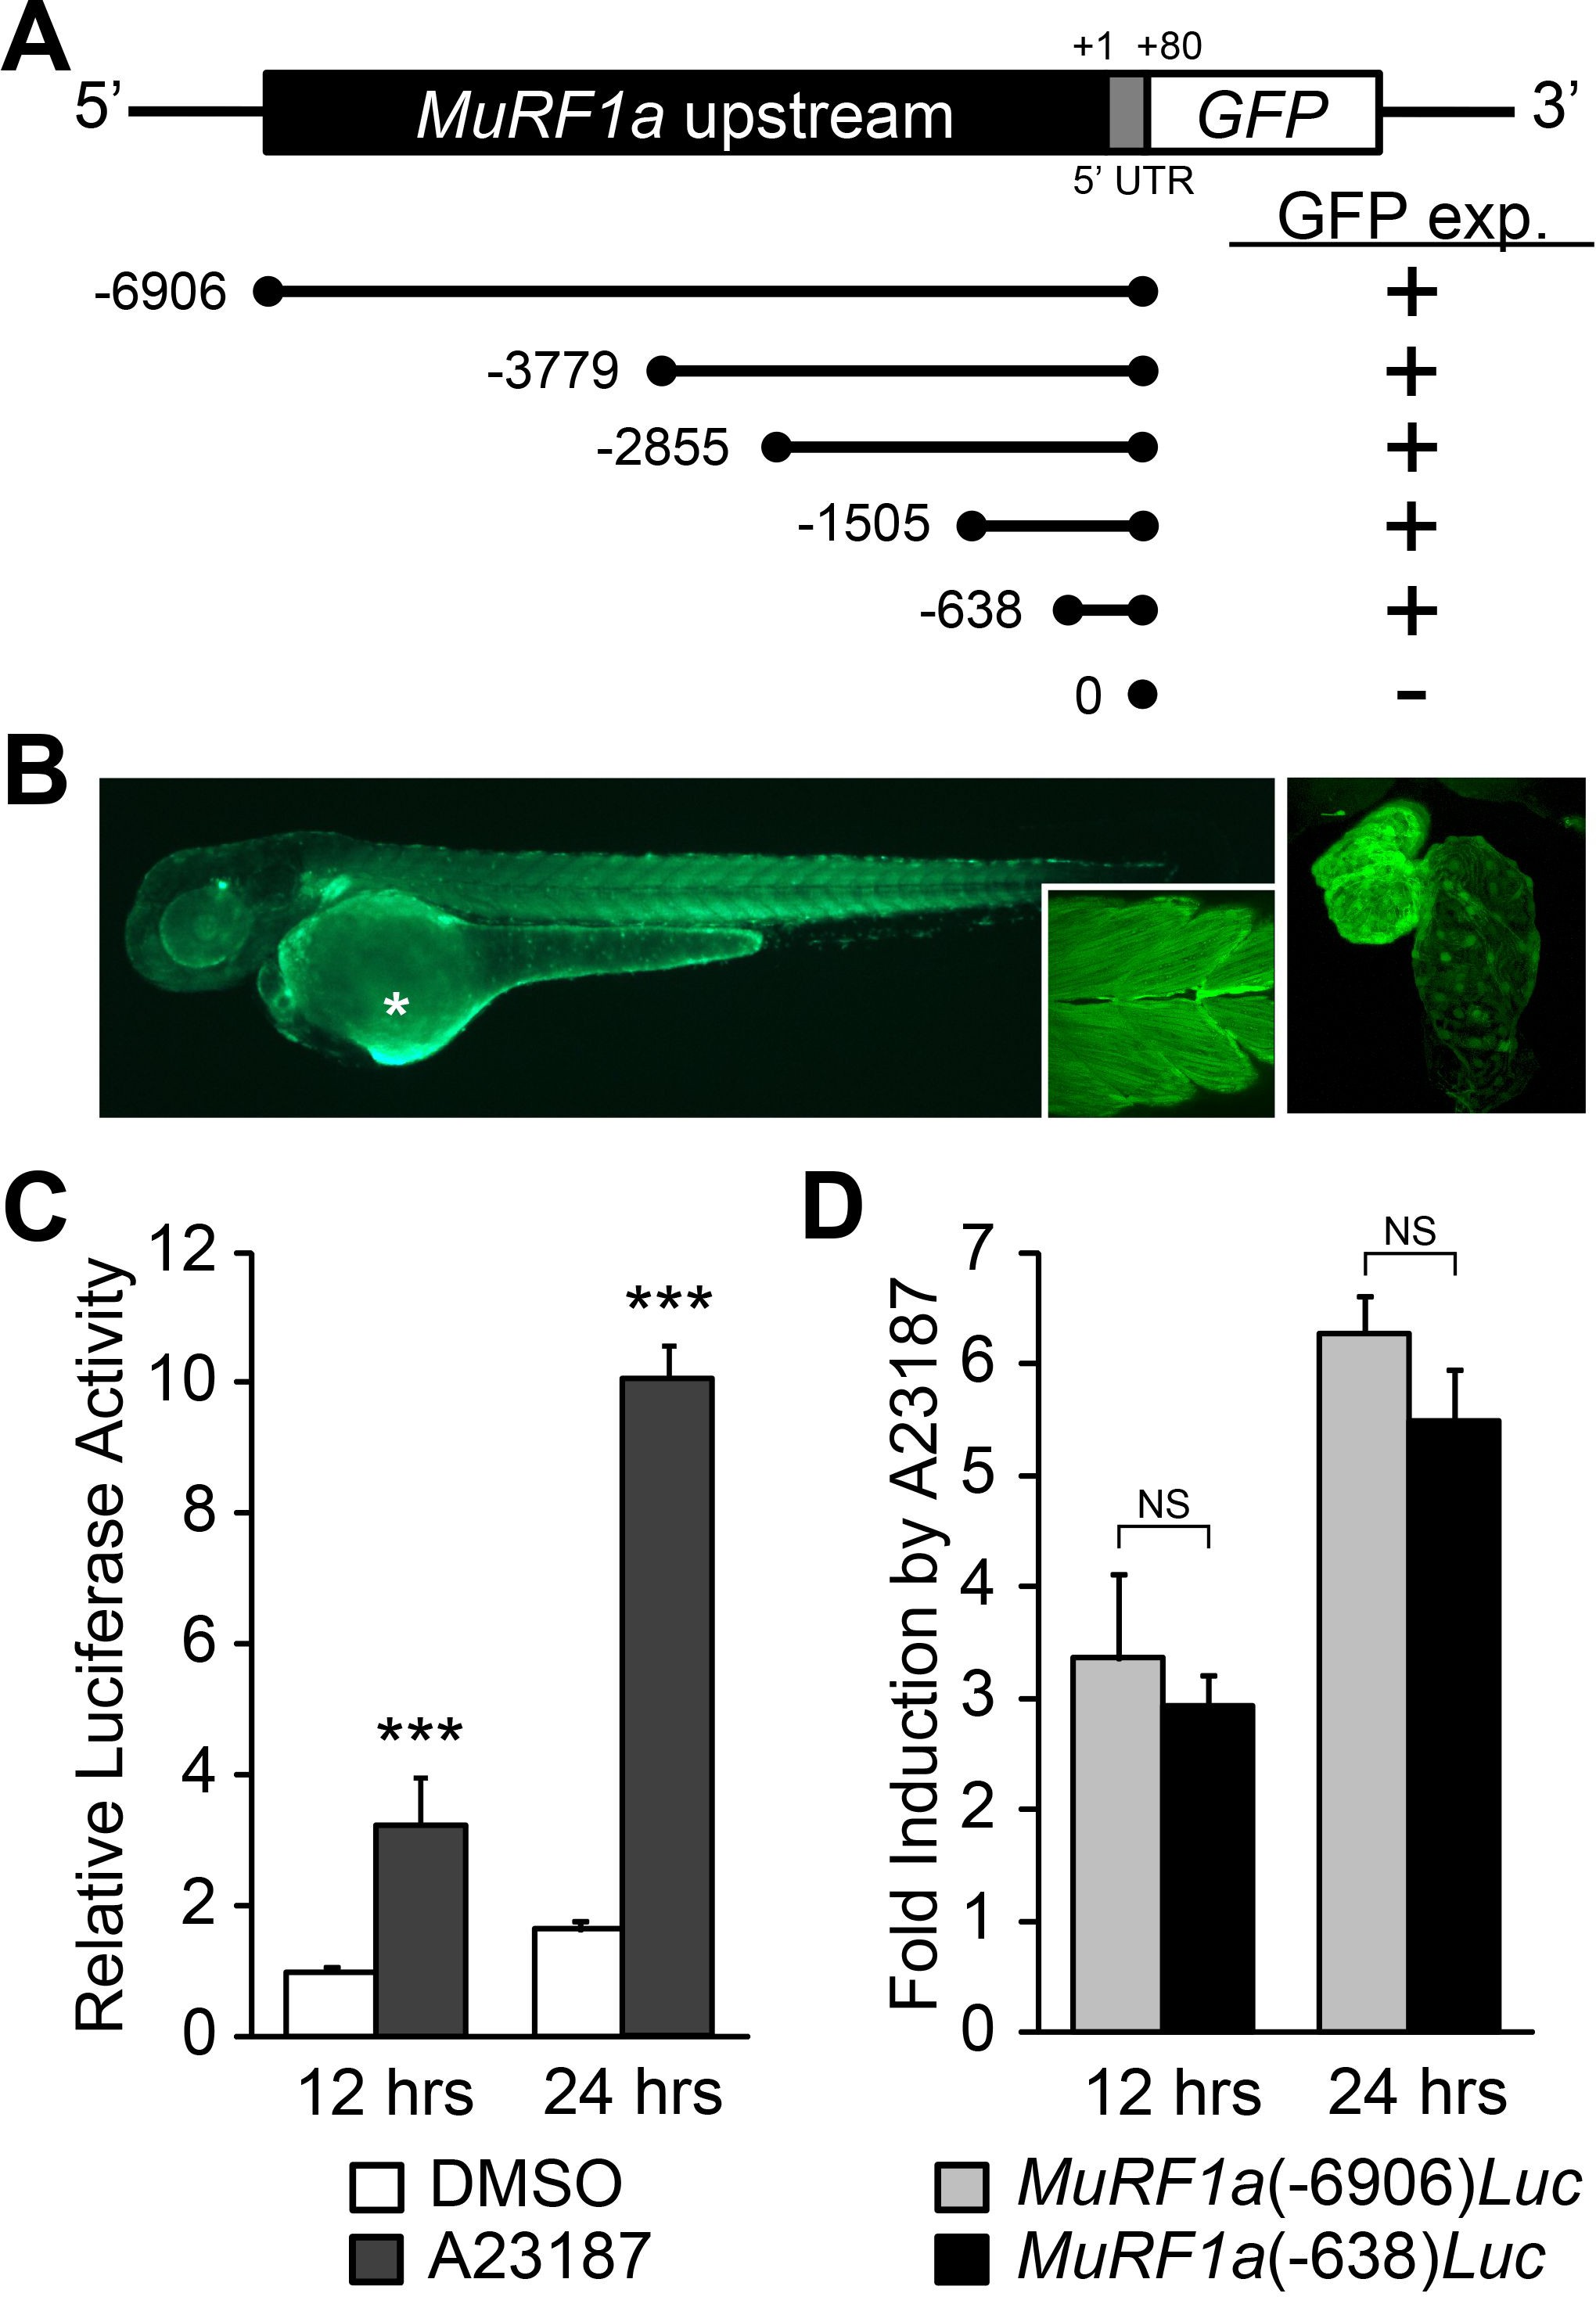
Fig. 6
Identification of a MuRF1a regulatory element.
(A) Schematic representation of murf1a reporter constructs. + denotes the presence of GFP expression in the heart and somites. (B) A MuRF1a (−6906)-GFP transgenic embryo exhibits GFP expression in the heart and the somites (inset shows higher magnification image of the somites). The right panel shows a higher magnification image of the heart. The asterisk denotes auto-fluorescence from the yolk. (C) A23187 treatment induces luciferase activity driven by the MuRF1a (−6906) promoter. Values on the y-axis represent the luciferase activity relative to cells treated with DMSO for 12 hr. (D) Comparison of Ca2+ responsiveness between the MuRF1a (−638) and MuRF1a (−6906) promoters. Values on the y-axis represent the fold increase in luciferase activity in response to A23187 treatment compared to DMSO-treated cells at each time point. ***p<0.001; NS, not significant.

