
|
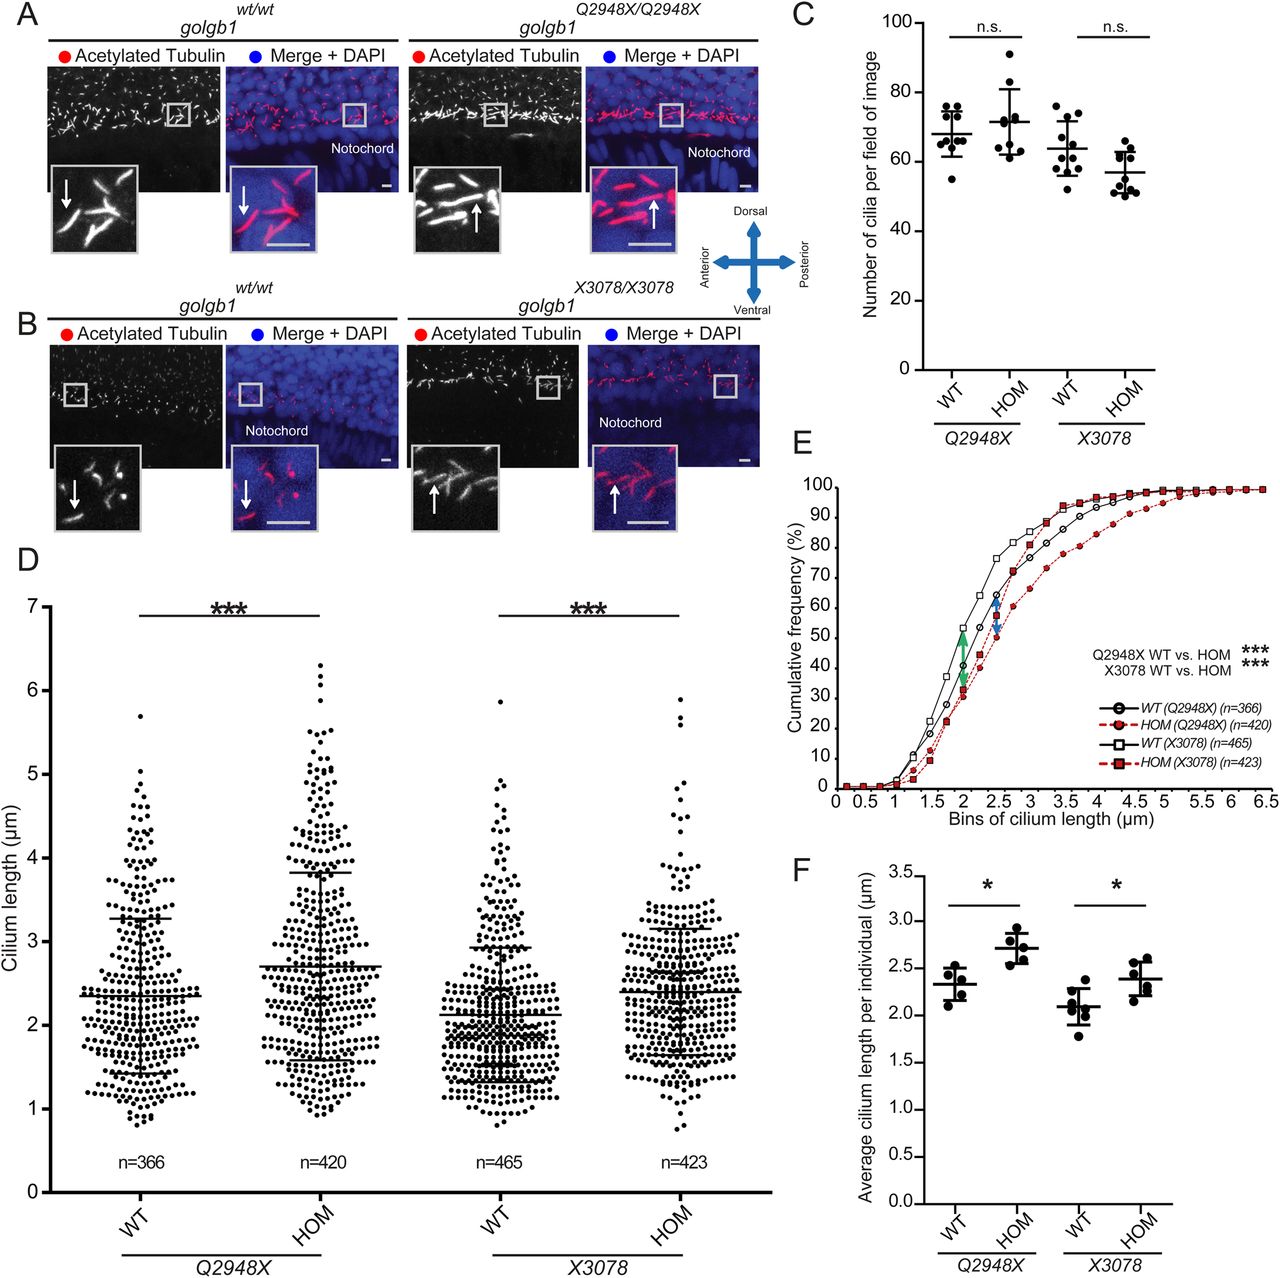
Fig. 3
Knockout of giantin results in defects in cilia length. (A,B) Lateral view confocal images of 24 hpf cilia in ventral neural tube of Q2948X mutant line (A) and X3078 mutant line (B). Scale bars: 10 μm. White arrows indicate ciliary axonemes. (C) Cilia number per field of image (two per individual) in a two nuclei wide area adjacent to the notochord. (D,E) Ciliary length of all cilia measured depicted in a scatter dot plot (D) and a cumulative frequency plot (E) showing shift (blue arrow Q2948X and green arrow X3078) in percentile abundance of binned (0.25 µm bins) ciliary length between WT and homozygous 24 hpf embryos. (F) Average ciliary length per individual imaged. Data shown from at least three independent in-crosses. Bars show mean with standard deviation. Data was normally distributed and a subsequent unpaired t-test was performed between wild-type and homozygous groups. *P<0.05, **P<0.01, and ***P<0.001.