Image
Figure Caption
Fig. S4
In situ hybridization analysis of expression of different auts2a transcript isoforms.
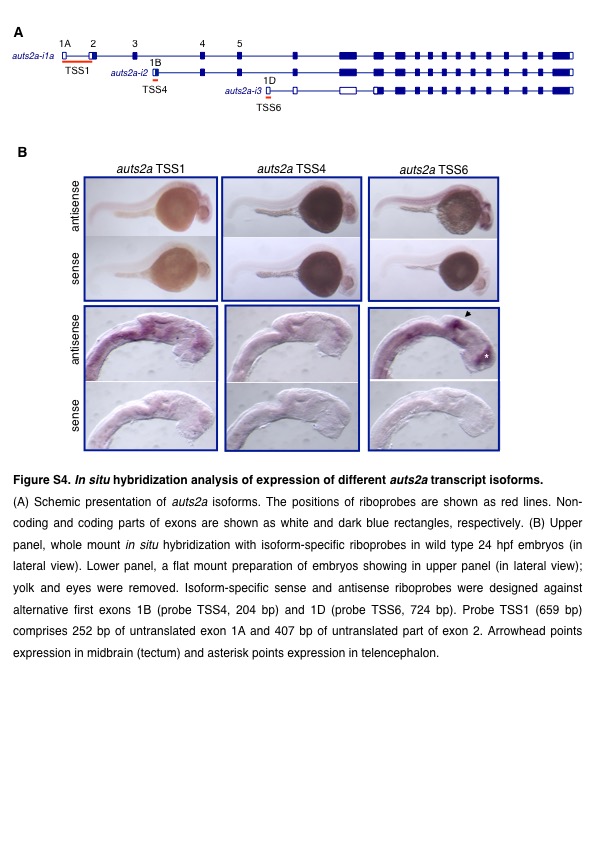
(A) Schemic presentation of auts2a isoforms. The positions of riboprobes are shown as red lines. Noncoding and coding parts of exons are shown as white and dalk blue rectangles, respectively. (B) Upper panel, whole mount in situ hybridization with isoform-specific riboprobes in wild type 24 hpf embryos (in lateral view). Lower panel, a flat mount preparation of embryos showing in upper panel (in lateral view); yolk and eyes were removed. lsoform-specific sense and antisense riboprobes were designed against alternative first exons 18 (probe TSS4, 204 bp) and 1D (probe TSS6, 724 bp). Probe TSS1 (659 bp) comprises 252 bp of untranslated exon 1 A and 407 bp of untranslated part of exon 2. Arrowhead points expression in midbrain (tectum) and asterisk points expression in telencephalon.
Acknowledgments
This image is the copyrighted work of the attributed author or publisher, and
ZFIN has permission only to display this image to its users.
Additional permissions should be obtained from the applicable author or publisher of the image.
Full text @ G3 (Bethesda)

