
|
Fig. 6
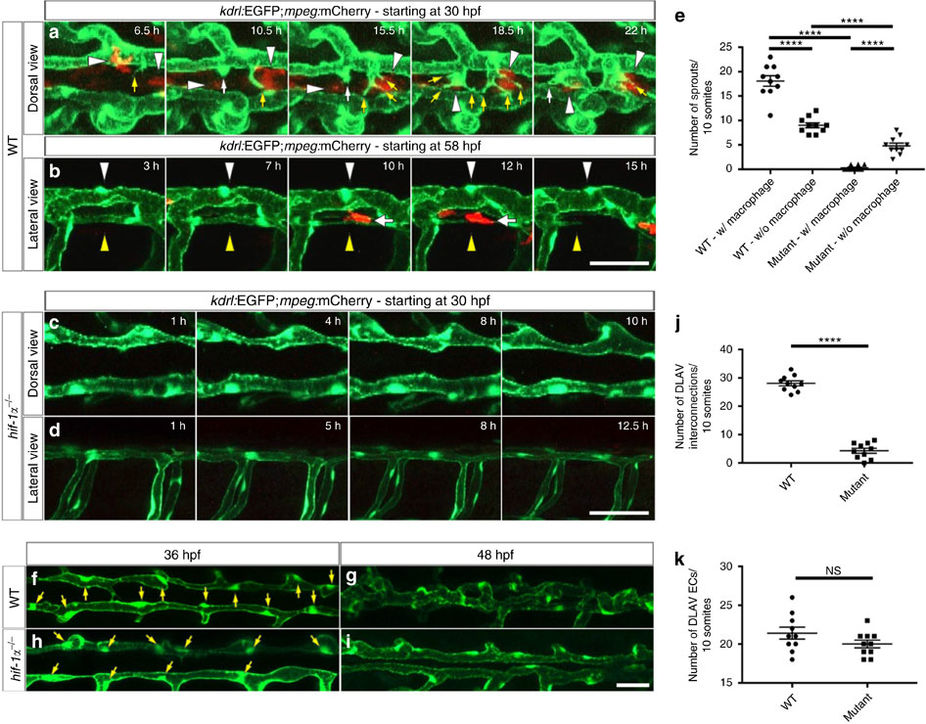
DLAV plexus formation is a macrophage-associated process and it is absent in hif-1α mutants.
(a) Maximal intensity projections of time-lapse confocal images of Tg(kdrl:EGFP);Tg(mpeg:mCherry) WT sibling embryo starting at 30 hpf; dorsal views. White arrowheads point to macrophages, yellow arrows to endothelial filopodial extensions, and white arrows to blunt-ended endothelial protrusions. (b) Maximal intensity projections of time-lapse confocal images of Tg(kdrl:EGFP);Tg(mpeg:mCherry) WT sibling embryo starting at 58 hpf; lateral views. White arrowheads point to a segment of a stable and perfused DLAV vessel, yellow arrowheads point to a non-perfused and regressing DLAV vessel, and white arrows point to a macrophage in contact with the regressing vessel. (c,d) Maximal intensity projections of time-lapse confocal images of Tg(kdrl:EGFP);Tg(mpeg:mCherry) hif-1α mutants starting at 30 hpf in dorsal and lateral views. DLAV plexus formation fails to occur in hif-1α mutants. (e) Quantification of sprouts physically associated (w/) or not (w/o) to macrophages in WT and hif-1α−/− embryos between 36 and 48 hpf. (f–i) Maximal intensity projections of confocal z-stacks of Tg(kdrl:EGFP) WT sibling and hif-1α−/− embryos at 36 and 48 hpf; dorsal views. Yellow arrows point to nuclei. (j) Quantification of DLAV interconnections in WT and hif-1α−/− embryos occurring between 36 and 48 hpf. (k) Quantification of EC numbers in the DLAVs in WT and hif-1α−/− embryos at 36 hpf. Bars represent mean±s.e.m., n=10 embryos from three different clutches, (****P<0.0001; NS, no significant changes observed; t-test). Scale bars, 50 μm.