
|
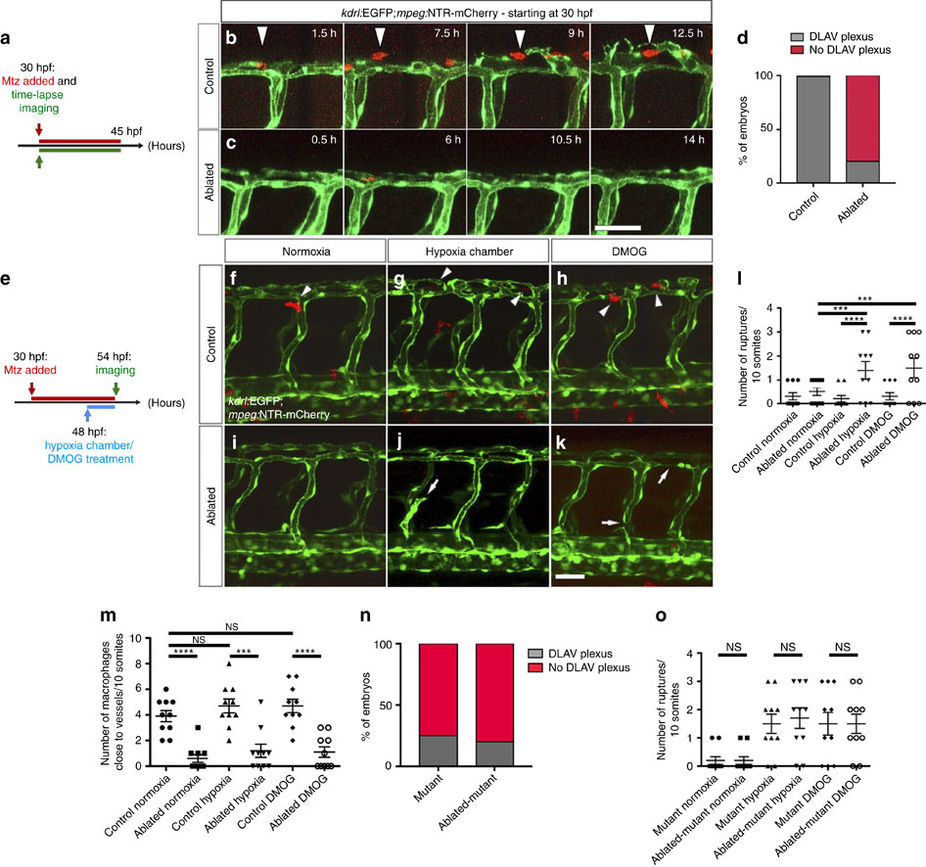
Fig. 4
Macrophage ablation leads to the absence of DLAV plexus formation as well as hypoxia-induced vascular disconnections.
(a) Schematic representation of the experiment shown in b–d. (b,c) Maximal intensity projections of time-lapse confocal images of control Tg(kdrl:EGFP);Tg(mpeg:NTR-mCherry) and macrophage-ablated embryos in normoxia starting at 30 hpf. Arrowheads point to a macrophage co-localizing with EC sprouts. (d) Quantification of embryos showing normal (grey) or abnormal/absent (red) DLAV plexus formation in 54 hpf control and macrophage-ablated embryos. (e) Schematic representation of the experiment shown in f–m. (f–k) Maximal intensity projections of confocal z-stacks of 54 hpf control Tg(kdrl:EGFP);Tg(mpeg:NTR-mCherry) and macrophage-ablated embryos in normoxia, after hypoxia chamber or DMOG treatment for 6 h starting at 48 hpf. All images represent lateral views. Arrowheads point to macrophages in proximity to blood vessels, and arrows to vessel ruptures. (l) Quantification of blood vessel ruptures in a 10 somite-long trunk area in 54 hpf control and macrophage-ablated embryos in normoxia, after hypoxia chamber or DMOG treatment for 6 h starting at 48 hpf. (m) Quantification of macrophages in proximity to blood vessels in a 10 somite-long trunk area in 54 hpf control and macrophage-ablated embryos in normoxia, after hypoxia chamber or DMOG treatment for 6 h starting at 48 hpf. n=10 embryos for each condition. (n) Quantification of embryos showing normal (grey) or abnormal/absent (red) DLAV plexus formation in 54 hpf control and macrophage-ablated hif-1α−/−embryos. (o) Quantification of blood vessel ruptures in a 10 somite-long trunk area in 54 hpf control and macrophage-ablated hif-1α−/−embryos in normoxia, after hypoxia chamber or DMOG treatment for 6 h starting at 48 hpf. Bars represent mean±s.e.m., n=10 embryos from three different clutches, (***P<0.001; ****P<0.0001; NS, no significant changes observed; t-test). Scale bars, 50 μm.