
|
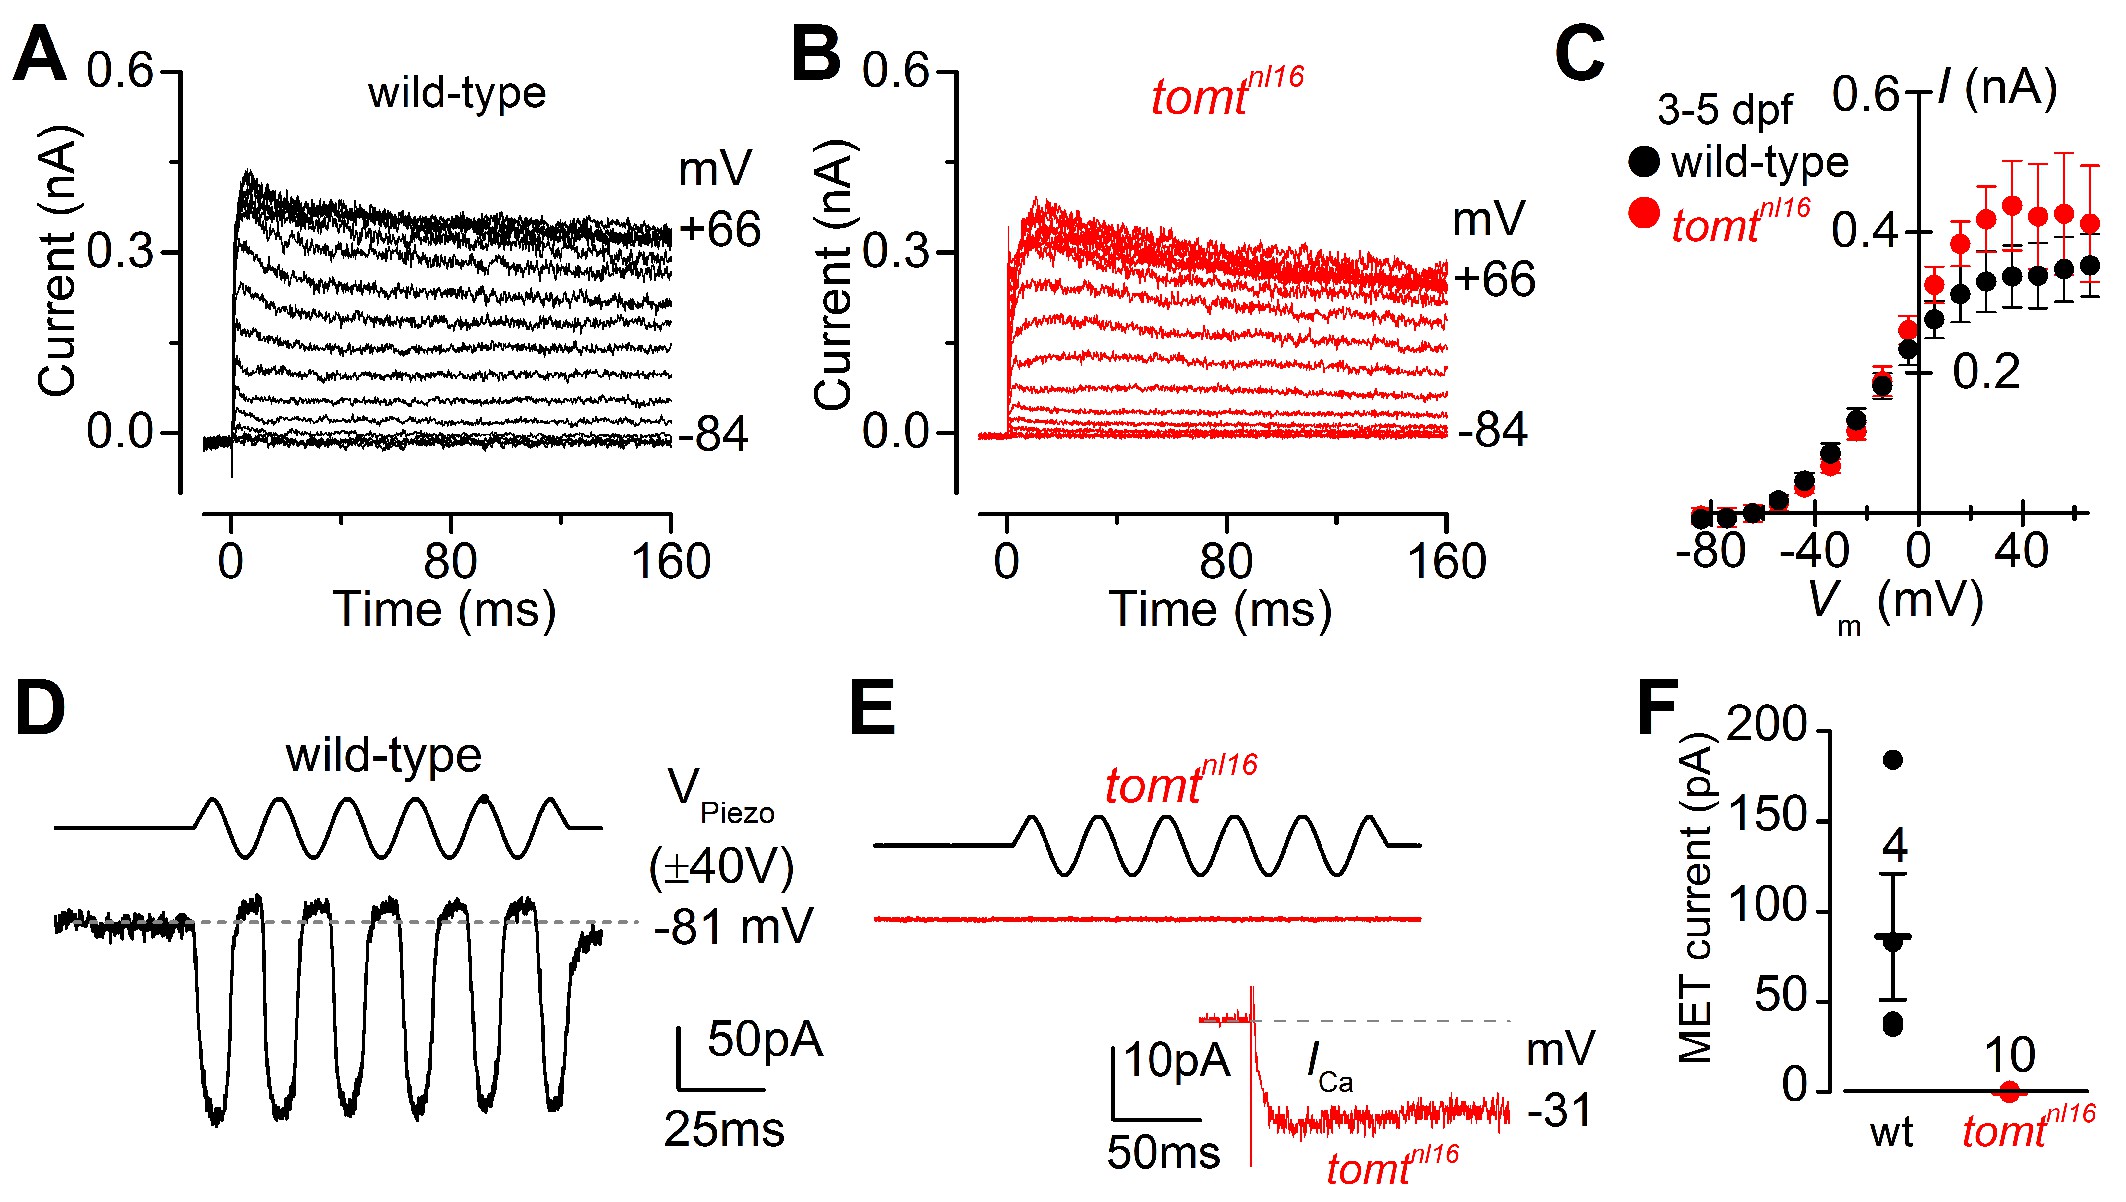
Fig. 4 Tomt-deficient hair cells have no mechanotransduction (MET) current.
(A, B) Examples of K+ currents recorded from lateral line hair cells in wild-type sibling (A) and tomtnl16 mutant (B) zebrafish. Currents were elicited by depolarizing and hyperpolarizing voltage steps in 10 mV nominal increments from the holding potential of –84 mV. (C) Average peak current-voltage (I-V) curves from hair cells in wild-type (n = 4) and tomtnl16 mutant (n = 3) hair cells, including those in panels A and B. (D, E) Saturating MET currents in 4 dpf zebrafish recorded from wild-type (D) and tomtnl16 mutant (E) lateral line hair cells in response to a 50 Hz sinusoidal force stimulus to the hair bundles at the membrane potential of –81 mV, which is indicated by the dashed line (D). VPiezo indicates the driver voltage to the fluid jet, with positive deflections moving the hair bundles in the excitatory direction. Note the absence of the MET current in the tomtnl16 mutant hair cell (E). The inset in panel E shows the calcium current recorded from the same cell in response to 150 ms depolarizing voltage steps in 10 mV increments from the holding potential of –81 mV. For clarity, only the peak Ca2+ current trace at –31 mV is shown. (F) Average maximum MET current in both wild-type (wt) and mutant ( tomtnl16) hair cells. Mean values in this Figure and text are quoted as means ± S.E.M.