
|
Fig. 4
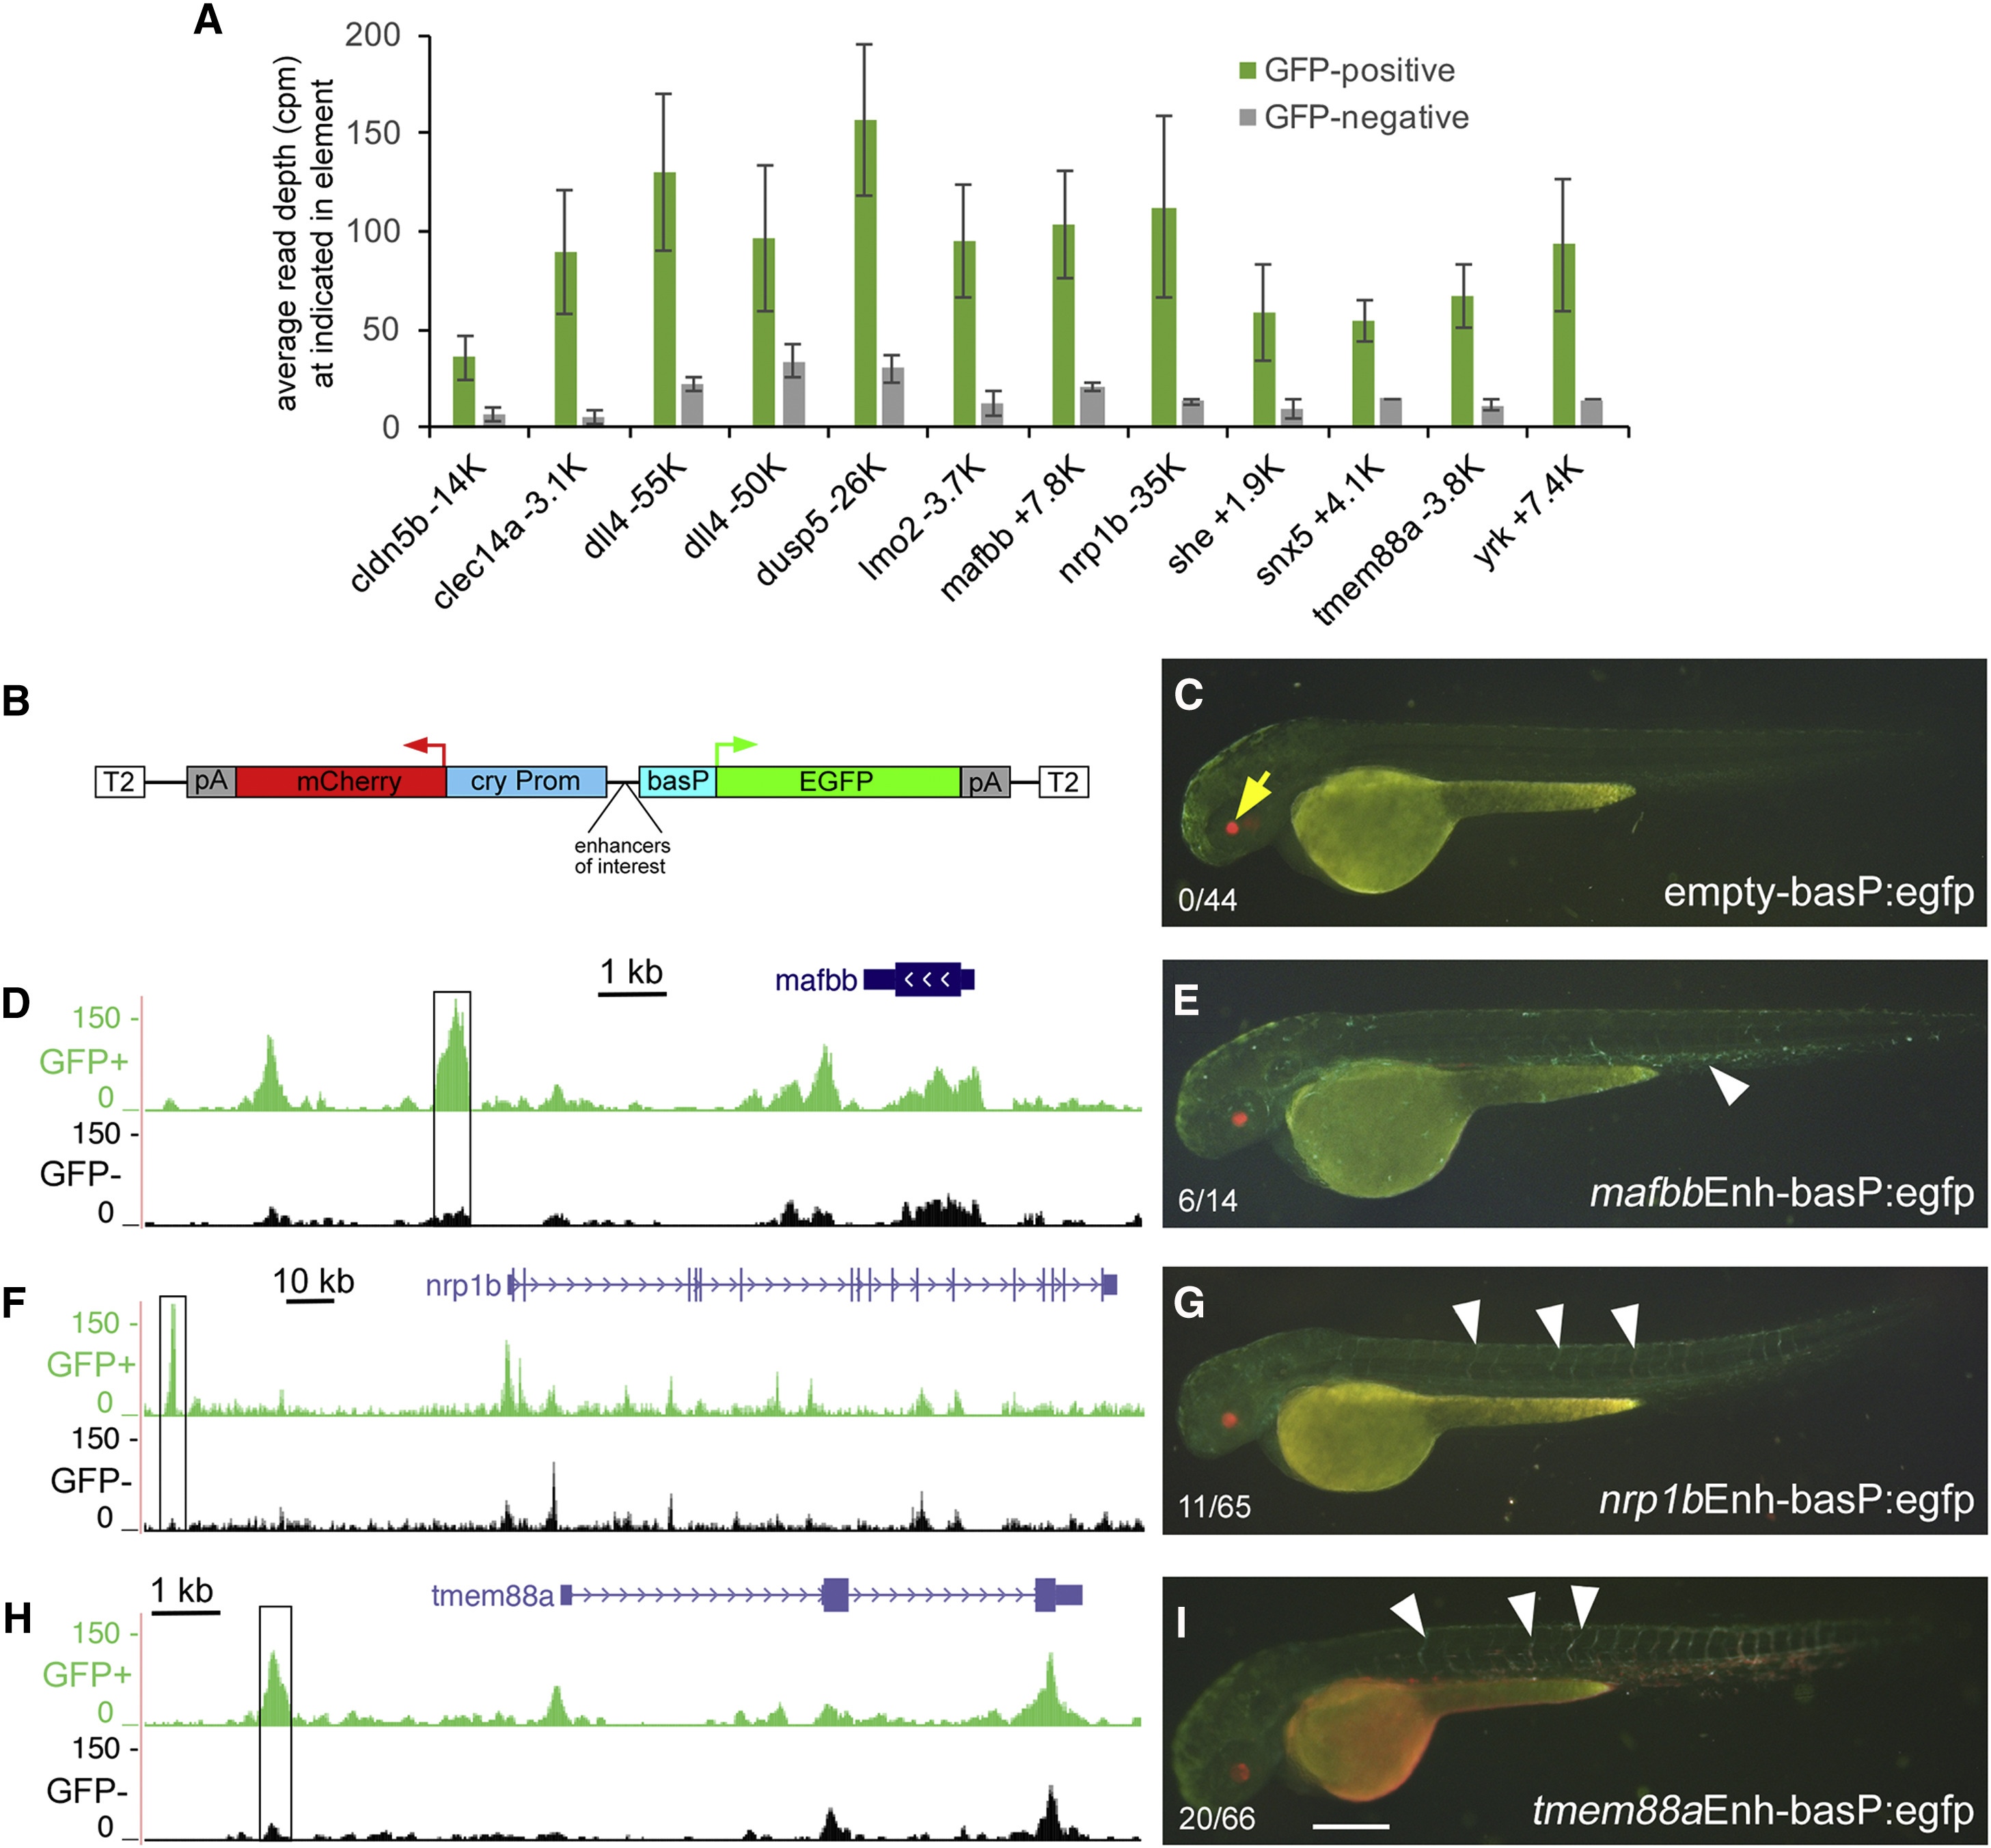
GFP-Positive Elements Can Drive Endothelial Gene Expression
(A) Average read depth, in counts per million (cpm), at each element used for reporter assays. Data are represented as mean ± SD from triplicate ATAC-seq libraries. All elements display GFP+/GFP– log2 fold change >1 (p < 0.0001; FDR < 0.05; biological triplicates). Name of adjacent endothelial gene shown on x axis with distance (in kilobases) and direction (“+” = downstream; “–” = upstream) of enhancer relative to TSS.
(B) Tol2 plasmid backbone used for reporter assays.
(C, E, G, and I) Overlays of green and red fluorescent images from embryos injected with reporter constructs. Lateral views: dorsal is up, and anterior is to the left. Ratios in left bottom denote number of embryos with GFP expression over number of cryaa:mcherry-expressing embryos from replicate injections. Embryos injected with (C) reporter with only basal promoter driving EGFP, or reporter with elements (E) downstream of mafbb, (G) upstream of nrp1b or (I) tmem88a. (D, F, and H) Mapped reads flanking indicated genes from GFP-positive and -negative nuclei isolated from Tg(fli1a:egfp)y1 embryos.
(E, G, and I) White arrowheads denote low-level expression in trunk endothelial cells. Black boxes are elements used in reporter assays. Scale bar, 250 μm.